Multistate Outbreak of Salmonella Bareilly and Salmonella Nchanga Infections Associated with a Raw Scraped Ground Tuna Product (Final Update)
Posted July 26, 2012 5:30 PM ET
This outbreak appears to be over. However, Salmonella is an important cause of human illness in the United States. More information about Salmonella, and steps people can take to reduce their risk of infection, can be found on the CDC Salmonella Web Page and the CDC Vital Signs Web Page.
Epi Curve
This outbreak can be visually described with a chart showing the number of persons who became ill each day. This chart is called an epi curve. Please see the Timeline for Reporting of Salmonella Cases for more details on the reporting process.
Current Epi Curve
Persons infected with the outbreak strains of Salmonella Bareilly and Salmonella Nchanga, by date of illness onset*
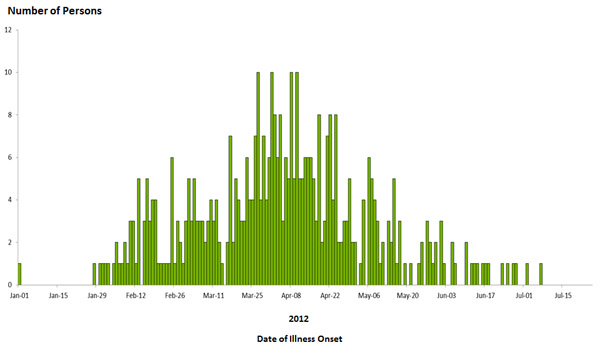
*n=425 for whom information was reported as of July 25, 2012
« Read the full Outbreak Investigation
Previous Epi Curves
Epi Curve: June 19, 2012
Persons infected with the outbreak strains of Salmonella Bareilly and Salmonella Nchanga, by date of illness onset*
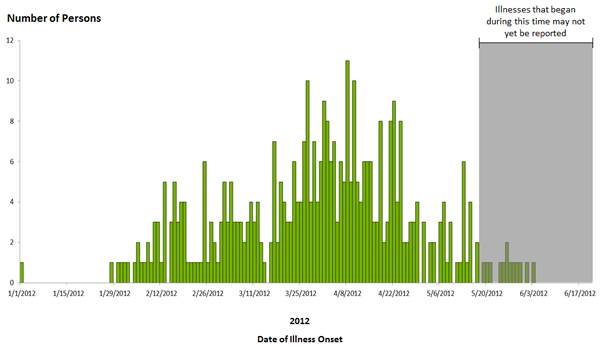
*n=390 for whom information was reported as of June 19, 2012. Illnesses that occurred after May 18, 2012 might not yet be reported due to the time it takes between when a person becomes ill and when the illness is reported. This takes an average of 2 to 3 weeks.
Epi Curve: May 14, 2012
Persons infected with the outbreak strains of Salmonella Bareilly and Salmonella Nchanga, by date of illness onset*
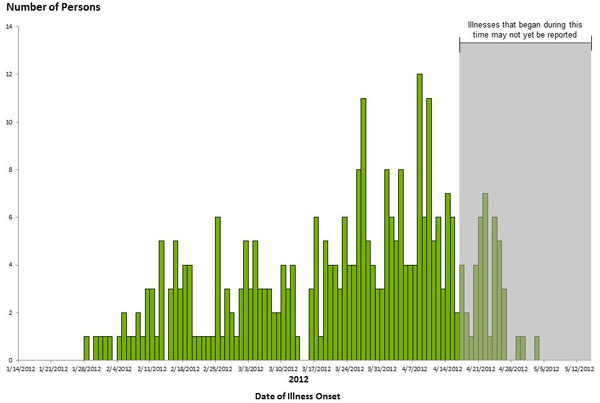
*n=316 for whom information was reported as of May 14, 2012. Illnesses that occurred after April 17, 2012 might not yet be reported due to the time it takes between when a person becomes ill and when the illness is reported. This takes an average of 2 to 3 weeks.
Epi Curve: May 1, 2012
Persons infected with the outbreak strains of Salmonella Bareilly and Salmonella Nchanga, by date of illness onset*
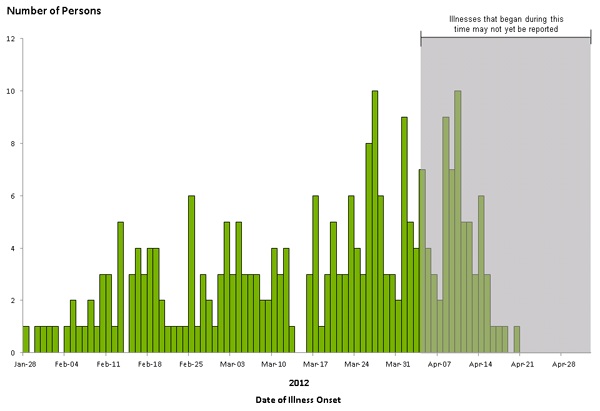
*n=258 for whom information was reported as of May 1, 2012. Illnesses that occurred after April 4, 2012 might not yet be reported due to the time it takes between when a person becomes ill and when the illness is reported. This takes an average of 2 to 3 weeks.
Epi Curve: April 23, 2012
Persons infected with the outbreak strains of Salmonella Bareilly and Salmonella Nchanga, by date of illness onset*
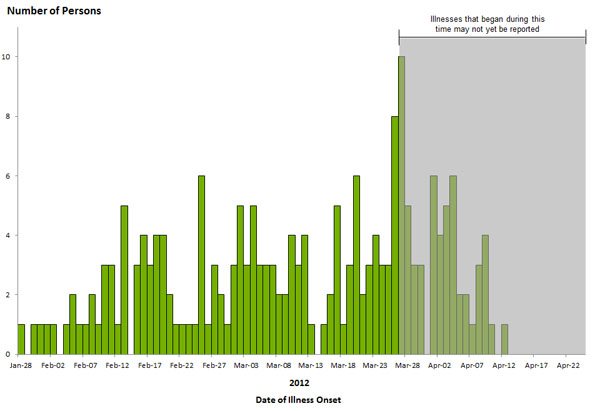
*n=200 for whom information was reported as of April 23, 2012. Illnesses that occurred after March 27, 2012 might not yet be reported due to the time it takes between when a person becomes ill and when the illness is reported. This takes an average of 2 to 3 weeks.
Epi Curve: April 19, 2012
Persons infected with the outbreak strain of Salmonella Bareilly, by date of illness onset*
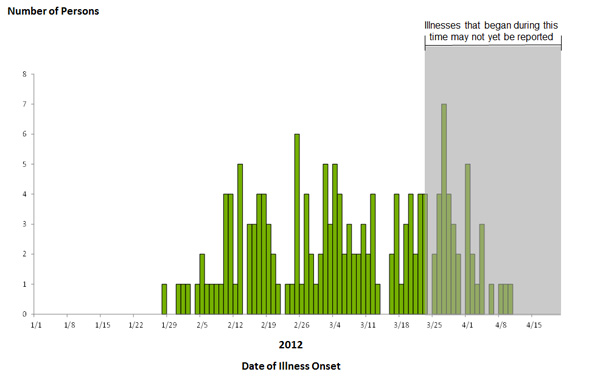
*n=160 for whom information was reported as of April 19, 2012. Illnesses that occurred after March 24, 2012 might not yet be reported due to the time it takes between when a person becomes ill and when the illness is reported. This takes an average of 2 to 3 weeks.
Epi Curve: April 16, 2012
Persons infected with the outbreak strain of Salmonella Bareilly, by date of illness onset*
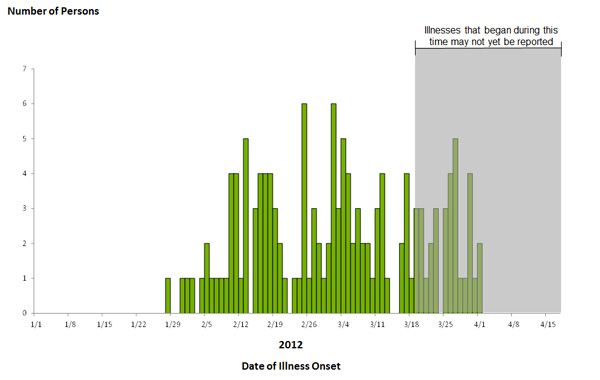
*n=139 for whom information was reported as of April 16, 2012. Illnesses that occurred after March 20, 2012 might not yet be reported due to the time it takes between when a person becomes ill and when the illness is reported. This takes an average of 2 to 3 weeks.
Epi Curve: April 10, 2012
Persons infected with the outbreak strain of Salmonella Bareilly, by date of illness onset*
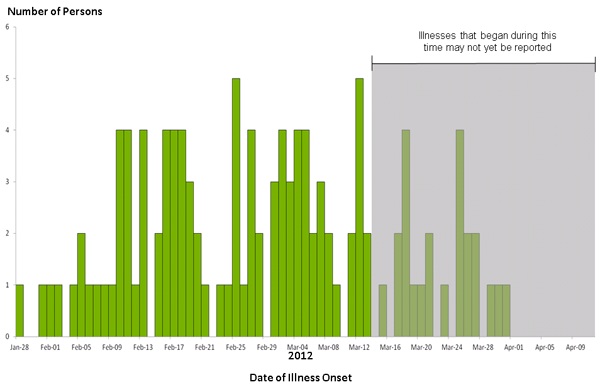
*n=116 for whom information was reported as of April 10, 2012. Illnesses that occurred after March 14, 2012 might not yet be reported due to the time it takes between when a person becomes ill and when the illness is reported. This takes an average of 2 to 3 weeks.
Epi Curve: April 5, 2012
Persons infected with the outbreak strain of Salmonella Bareilly, by date of illness onset*
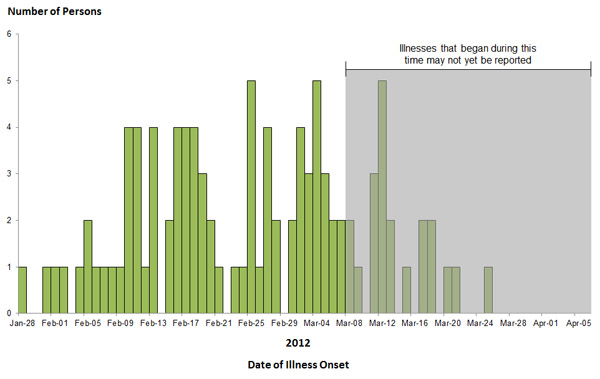
*n=100 for whom information was reported as of April 5, 2012. Illnesses that occurred after March 8, 2012 might not yet be reported due to the time it takes between when a person becomes ill and when the illness is reported. This takes an average of 2 to 3 weeks.
Epi Curve: April 4, 2012
Persons infected with the outbreak strain of Salmonella Bareilly, by date of illness onset*
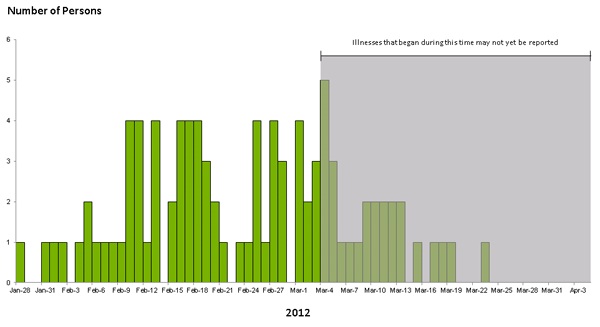
*n=93 for whom information was reported as of April 4, 2012. Illnesses that occurred after March 4, 2012 might not yet be reported due to the time it takes between when a person becomes ill and when the illness is reported. This takes an average of 2 to 3 weeks.
Get email updates
To receive email updates about this page, enter your email address:
Contact Us:
- Centers for Disease Control and Prevention
1600 Clifton Rd
Atlanta, GA 30333 - 800-CDC-INFO
(800-232-4636)
TTY: (888) 232-6348 - New Hours of Operation
8am-8pm ET/Monday-Friday
Closed Holidays - cdcinfo@cdc.gov
