| |
LEGEND:
 |
 |
|
Link to a PDF document |
|
|
 |
|
Link to non-governmental site and does not
necessarily represent the views of the CDC |

|
|
|
| Adobe
Acrobat (TM) Reader needs to be installed on
your computer in order to read documents in PDF format.
Download the Reader.
|
|
|
|
|
|
|
| Maps Based on Data from 2010 HIV Surveillance Report |
|
|
|
Instructions for downloading and using
HIV/AIDS surveillance slides.
Download the
complete slide set:
While the content is in the public domain and
no copyright restriction applies,
we do ask that users preserve the slides in
their current format and cite CDC as the
source.
|

Slide 1
Diagnoses of HIV Infection, 2010
46 States and 5 U.S. Dependent Areas |
|

Slide 2
Rates of Diagnoses of HIV Infection,
2010
46 States and 5 U.S. Dependent Areas |
|

Slide 3
AIDS Diagnoses, 2010
U.S. and 5 U.S. Dependent Areas |
|

Slide 4
Rates of AIDS Diagnoses, 2010
U.S. and 5 U.S. Dependent Areas |
|

Slide 5
Cumulative AIDS Diagnoses, through 2010,
adults and adolescents
United States and 5 U.S. Dependent Areas |
|

Slide 6
Cumulative AIDS Diagnoses, through 2010,
children aged <13 years
United States and 5 U.S. Dependent Areas
|
|
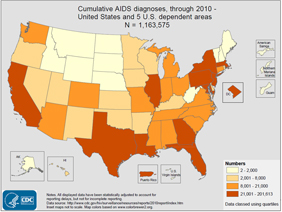
Slide 7
Cumulative AIDS Diagnoses, through 2010
United States and 5 U.S. Dependent Areas |
|

Slide 8
Adults and Adolescents Living with a
Diagnosis of HIV Infection, Year-end
2009
46 States and 5 U.S. Dependent Areas
|
|

Slide 9
Rates of Adults and Adolescents Living
with a Diagnosis of HIV Infection,
Year-end 2009
46 States and 5 U.S. Dependent Areas |
|

Slide 10
Adult and Adolescent American
Indians/Alaska Natives (AI/AN) Living
with a Diagnosis of HIV Infection,
Year-end 2009
46 States and 5 U.S. Dependent Areas |
|

Slide 11
Rates of Adult and Adolescent American
Indians/Alaska Natives (AI/AN) Living
with a Diagnosis of HIV Infection,
Year-end 2009
46 States
|
|

Slide 12
Adult and Adolescent Asians Living with
a Diagnosis of HIV Infection, Year-end
2009
46 States and 5 U.S. Dependent Areas |
|

Slide 13
Rates of Adult and Adolescent Asians
Living with a Diagnosis of HIV
Infection, Year-end 2009
46 States |
|

Slide 14
Adult and Adolescent Blacks/African
Americans Living with a Diagnosis of HIV
Infection, Year-end 2009
46 States and 5 U.S. Dependent Areas |
|
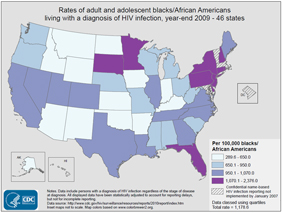
Slide 15
Rates of Adult and Adolescent
Blacks/African Americans Living with a
Diagnosis of HIV Infection, Year-end
2009
46 States |
|

Slide 16
Adult and Adolescent Hispanics/Latinos
Living with a Diagnosis of HIV
Infection, Year-end 2009
46 States and 5 U.S. Dependent Areas
|
|
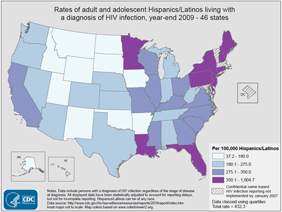
Slide 17
Rates of Adult and Adolescent
Hispanics/Latinos Living with a
Diagnosis of HIV Infection, Year-end
2009
46 States |
|
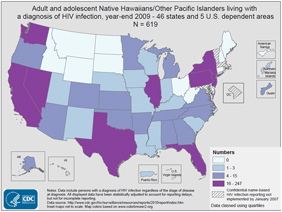
Slide 18
Adult and Adolescent Native
Hawaiians/Other Pacific Islanders (NHOPI)
Living with a Diagnosis of HIV
Infection, Year-end 2009
46 States and 5 U.S. Dependent Areas |
|

Slide 19
Rates of Adult and Adolescent Native
Hawaiians/Other Pacific Islanders (NHOPI)
Living with a Diagnosis of HIV
Infection, Year-end 2009
46 States
|
|

Slide 20
Adult and Adolescent Whites Living with
a Diagnosis of HIV Infection, Year-end
2009
46 States and 5 U.S. Dependent Areas |
|

Slide 21
Rates of Adult and Adolescent Whites
Living with a Diagnosis of HIV
Infection, Year-end 2009
46 States |
|
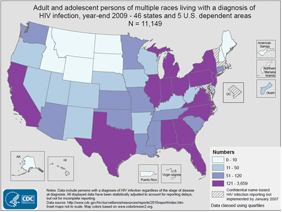
Slide 22
Adults and Adolescents of Multiple Races
Living with a Diagnosis of HIV
Infection, Year-end 2009
46 States and 5 U.S. Dependent Areas |
|

Slide 23
Rates of Adults and Adolescents of
Multiple Races Living with a Diagnosis
of HIV Infection, Year-end 2009
46 States |
|

Slide 24
Adults and Adolescents Living with an
AIDS Diagnosis, Year-end 2009
United States and 5 U.S. Dependent Areas |
|

Slide 25
Rates of Adults and Adolescents Living
with an AIDS Diagnosis, Year-end 2009
United States and 5 U.S. Dependent Areas |
|

Slide 26
Adult and Adolescent American
Indians/Alaska Natives (AI/AN) Living
with an AIDS Diagnosis, Year-end 2009
United States and 5 U.S. Dependent Areas |
|

Slide 27
Rates of Adult and Adolescent American
Indians/Alaska Natives (AI/AN) Living
with an AIDS Diagnosis, Year-end 2009
United States |
|

Slide 28
Adult and Adolescent Asians Living with
an AIDS Diagnosis, Year-end 2009
United States and 5 U.S. Dependent Areas |
|

Slide 29
Rates of Adult and Adolescent Asians
Living with an AIDS Diagnosis, Year-end
2009
United States |
|

Slide 30
Adult and Adolescent Blacks/African
Americans Living with an AIDS Diagnosis,
Year-end 2009
United States and 5 U.S. Dependent Areas |
|

Slide 31
Rates of Adult and Adolescent
Blacks/African Americans Living with an
AIDS Diagnosis, Year-end 2009
United States |
|

Slide 32
Adult and Adolescent Hispanics/Latinos
Living with an AIDS Diagnosis, Year-end
2009
United States and 5 U.S. Dependent Areas |
|

Slide 33
Rates of Adult and Adolescent
Hispanics/Latinos Living with an AIDS
Diagnosis, Year-end 2009
United States |
|
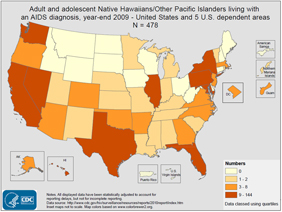
Slide 34
Adult and Adolescent Native
Hawaiians/Other Pacific Islanders (NHOPI)
Living with an AIDS Diagnosis, Year-end
2009
United States and 5 U.S. Dependent Areas |
|
Slide 35
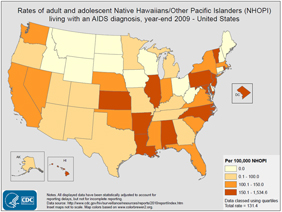
Rates of Adult and Adolescent Native
Hawaiians/Other Pacific Islanders (NHOPI)
Living with an AIDS Diagnosis, Year-end
2009
United States |
|

Slide 36
Adult and Adolescent Whites Living with
an AIDS Diagnosis, Year-end 2009
United States and 5 U.S. Dependent Areas |
|
Slide 37
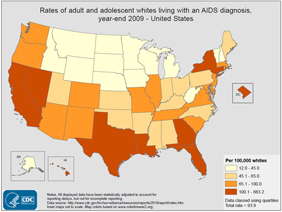
Rates of Adult and Adolescent Whites
Living with an AIDS Diagnosis, Year-end
2009
United States |
|

Slide 38
Adults and Adolescents of Multiple Races
Living with an AIDS Diagnosis, Year-end
2009
United States and 5 U.S. Dependent Areas |
|

Slide 39
Rates of Adults and Adolescents of
Multiple Races Living with an AIDS
Diagnosis, Year-end 2009
United States
|
|
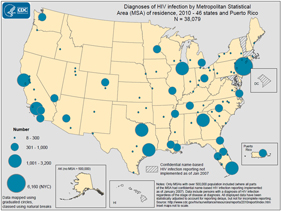
Slide 40
Diagnoses of HIV infection by
Metropolitan Statistical Area (MSA) of
residence, 2010
46 states and Puerto Rico |
|

Slide 41
Rates of diagnoses of HIV infection by
Metropolitan Statistical Area (MSA) of
residence, 2010
46 states and Puerto Rico |
|
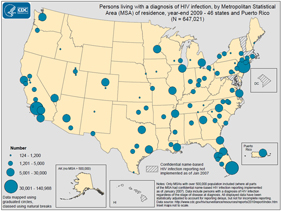
Slide 42
Persons living with a diagnosis of HIV
infection, by Metropolitan Statistical
Area (MSA) of residence, year-end 2009
46 states and Puerto Rico |
|

Slide 43
Rates of persons living with a diagnosis
of HIV infection, by Metropolitan
Statistical Area (MSA) of residence,
year-end 2009
46 states and Puerto Rico |
|

Slide 44
AIDS diagnoses by Metropolitan
Statistical Area (MSA) of residence,
2010
United States and Puerto Rico |
|
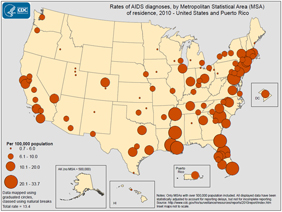
Slide 45
Rates of AIDS diagnoses, by Metropolitan
Statistical Area (MSA) of residence,
2010
United States and Puerto Rico
|
|

Slide 46
Persons living with an AIDS diagnosis,
by Metropolitan Statistical Area (MSA)
of residence, year-end 2009
United States and Puerto Rico |
|
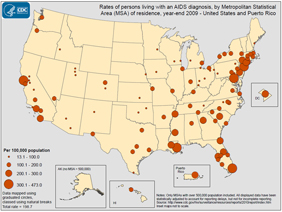
Slide 47
Rates of persons living with an AIDS
diagnosis, by Metropolitan Statistical
Area (MSA) of residence, year-end 2009
United States and Puerto Rico |
|
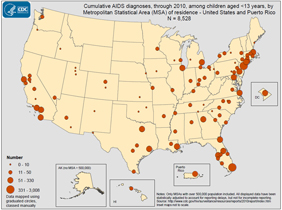
Slide 48
Cumulative AIDS diagnoses, through 2010,
among children aged <13 years, by
Metropolitan Statistical Area (MSA) of
residence
United States and Puerto Rico |
|
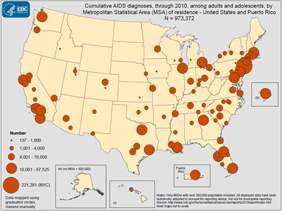
Slide 49
Cumulative AIDS diagnoses, through 2010,
among adults and adolescents, by
Metropolitan Statistical Area (MSA) of
residence
United States and Puerto Rico |
|

Slide 50
Slide 50: Cumulative AIDS diagnoses,
through 2010, by Metropolitan
Statistical Area (MSA) of residence
United States and Puerto Rico |
|
|
|
|