Posts tagged: Data

i-Tree 5.0 goes Mobile and Spreads Across the Globe

When Dave Nowak of the U.S. Forest Service and Scott Maco of Davey Tree Expert Company began collaborating on the creation of a suite of urban forest analysis tools called i-Tree, they imagined that users would be mostly city foresters from the  United States.

Six years later, the U.S. Forest Service is releasing i-Tree version 5.0 with changes inspired by users from 105 countries. Version 5.0 is upgraded to rapidly assess urban trees and forests throughout Canada and Australia, two of the countries leading i-Tree’s international expansion.

“It’s neat to see how this program has grown,” Nowak said. “We didn’t expect this kind of response, but the i-Tree partnership has done an outstanding job in reaching potential users.” Read more »

UPDATE: Drought Code Sprint Deadline Extended to October 24

After hearing from many of you, we are extending the deadline to submit your apps for the Drought Code Sprint to Wednesday, October 24 at 5 p.m. ET apps using this form.

Do you have any questions about our data or would you like to learn more about our drought assistance in general? Let us know, we’d love to help as you start coding! Read more »

USDA Drought Code Sprint: Giving Americans One-Click Access to Federal Drought Relief

Editor’s note: After hearing from many of you, we are extending the deadline to submit your apps for the Drought Code Sprint to Wednesday, October 24 at 5 p.m. ET.

Americans across the country are feeling the impact of the most severe and extensive drought in the last 25 years.  We’ve heard from people throughout the United States, asking how they can help. That’s why today we’re launching USDA’s first-ever Drought Code Sprint, a call to developers across the country to use publicly available government information to help farmers, ranchers, and others gain quick and reliable “one-click” access to information on drought conditions and Federal drought relief.  Developers can submit their apps using this form by Wednesday, October 24 at 5 p.m ET.  Some of the most innovative ones will be featured on USDA.gov.

Crops are withering as a result of this historic drought and feed for livestock is growing ever more scarce and expensive.  None of us is immune—these conditions are affecting over 50% of the country and almost 80% of our agricultural land.  But our rural communities and family farmers and ranchers are on the front lines, and have been the first to feel the drought’s full effects. They are working hard to overcome these hardships, and the Federal Government has stepped up to help.

Of course, apps can’t influence the weather or refill our reservoirs. But they can help farmers and ranchers become more easily aware of the kinds of assistance available to them, and they can simplify the process of taking advantage of these options so relief gets to the people who need it as efficiently as possible.

Some tools we’d love to see include apps that provide “one-click” access to the nearest USDA service centers and available drought programs; county-level drought disaster designations and program eligibility; information on Federal assistance available based on location and sector; types of loans or refinance options available with a handy repayment calculator and eligibility requirements; drought maps; and localized weather outlooks.  These are just a few of our ideas but we’re confident that you have even better ones—so get coding!

To get started, check out these publicly available data sets in the Natural Hazards Data Community on Safety.Data.gov and on the USDA drought website:

We encourage developers to use other freely available resources on safety.data.gov or the USDA website as well—including Agriculture Weather and Drought Outlook blog posts and Drought Assistance Programs and Information sites—and any other data resources that would be helpful to those affected by the drought.

Here is a great opportunity to apply American ingenuity and technology to the cause of helping America’s farms. We look forward to seeing your ideas.

Creatively Shaping the Future of Federal Nutrition Research

Are you interested in helping shape the future of USDA human nutrition research? What human nutrition-related issues are you interested in? Childhood obesity? The nutrient content of foods? Health promotion and disease prevention? Now’s your chance to let your voice be heard. Be an active participant by visiting our “Idea Space” and sharing your thoughts with us. Your input will help guide us in setting our human nutrition research priorities for the future. Our research helps solves problems that affect Americans’ lives every day. Help us decide which problems should be our priorities.

As USDA’s chief scientific research agency, the Agricultural Research Service (ARS) is leading America towards a better future through agricultural research and information. Now ARS wants your input in planning its human nutrition research program for the next five years. Read more »

US Drought and Your Food Costs

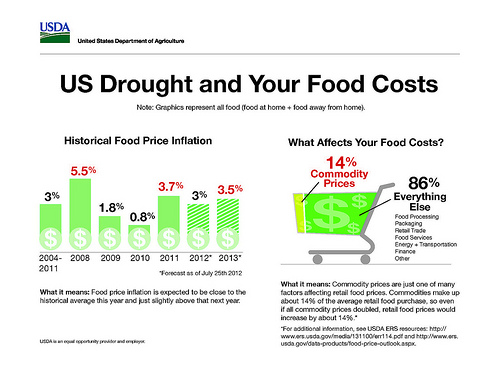
This info graphic demonstrate how the current drought, or any event that affects prices for raw farm commodities, ultimately has a marginal effect on what we pay at the grocery or restaurant. The info graphic is based on data from the USDA Economic Research Service's analysis of retail food prices and the food dollar, or all the factors that affect what we pay for food.

This info graphic demonstrate how the current drought, or any event that affects prices for raw farm commodities, ultimately has a marginal effect on what we pay at the grocery or restaurant. The info graphic is based on data from the USDA Economic Research Service's analysis of retail food prices and the food dollar, or all the factors that affect what we pay for food. (Click to enlarge)

In relation to the current drought, many people ask: What does this mean for food prices? Here we try to provide a response and the necessary context on food price inflation. The info graphic is based on data from the USDA Economic Research Service’s analysis of retail food prices and the food dollar, or all the factors that affect what we pay for food. The graphic helps to demonstrate how the current drought, or any event that affects prices for raw farm commodities, ultimately has a marginal effect on what we pay at the grocery or restaurant. Primarily, the graphic demonstrates two important pieces of information:

1. In the bar chart, food price inflation is expected to be close to the historical average this year and just slightly above that next year. As you can see, recent spikes from 2008 and 2011, especially, outpace current forecasts.

2. In the grocery cart model, you see that raw farm commodity prices (the price of things like a bushel of corn or soybeans) are just one of many factors affecting retail food prices. In fact, commodities make up about 14% of the average retail food purchase, so even if all commodity prices doubled, retail food prices would increase by about 14%. Together, factors such as energy and transportation costs, labor costs, processing and marketing costs all play a much more significant role.

On July 25th, ERS forecast that we will likely see impacts on retail food prices within two months for beef, pork, poultry and dairy. Yet the full effects of the increase in corn prices for packaged and processed foods (cereal, corn flour, etc.) will likely take 10-12 months to move through to retail food prices, and should have little to no effect until that time.

For additional information, see USDA ERS resources: A Revised and Expanded Food Dollar Series A Better Understanding of Our Food Costs (PDF) and Food Price Outlook web page.

Data Dashboards: Bringing More Market Information to Life

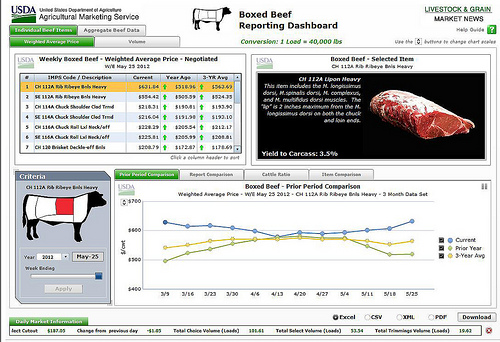
A screenshot of the Boxed Beef Dashboard. The livestock dashboards allow you to see weekly volume and price information presented in graphs and tables that can be customized for viewing and downloaded for use in reports and presentations.

A screenshot of the Boxed Beef Dashboard. The livestock dashboards allow you to see weekly volume and price information presented in graphs and tables that can be customized for viewing and downloaded for use in reports and presentations.

It has been said that the most successful person in life (and in business) is often the one who has the best information.  For almost a century USDA Market News has been providing farmers, ranchers and businesses with the best market and pricing information.  Our real-time commodity reports, produced by the Agricultural Marketing Service (AMS), provide quick and easy access to volume and price information for boxed beef, cattle, hogs, and sheep.

Over the years, our reports have evolved to better meet the changing demands of the farmers and ranchers who rely on our data to remain competitive.  In the summer of 2010, we launched the first of our livestock data dashboards, providing a highly customized experience for our data consumers.

The Boxed Beef Dashboard, the newest addition to the Livestock and Grain Market News dashboards, includes a lot of the same great tools that have made our other dashboards so popular—interactive features for querying and viewing information, like navigation tabs, slide bars, graphs, tables, and daily market tickers.

A unique feature on the new Boxed Beef Dashboard displays a diagram of a steer that dynamically illustrates the area of the animal the cut of meat comes from. It also shows a color photograph and brief description of the wholesale beef cut, providing quick visual cues to help sort and sift the information more quickly.

Like all of our dashboards, it also offers a range of options to download and export custom datasets, giving you only the datapoints that are most meaningful to you.  The users’ guide provides a feature-by-feature overview of the dashboard and is a great place to start if you’re new to the datasets.

USDA Market News has been providing market information on cotton, dairy, livestock and grains, poultry and eggs, and fruits and vegetables for over 90 years. By visiting USDA Market News you can view hundreds of pre-made commodity reports—including the livestock dashboards—or create a custom report to see only the information you need.

Get the same insight as other industry insiders—visit the livestock dashboards.