
Newly Updated Food Availability Data Reflect the Changing American Diet
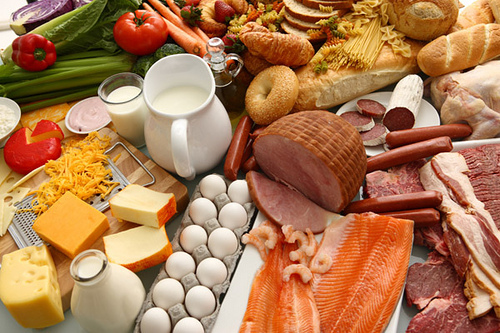
USDA’s Economic Research Service estimates the availability of hundreds of commodities for human consumption. The Food Availability (Per Capita) Data System includes historical as well as recent data. (Photo courtesy of Shutterstock)
True or false?
- Since 1985, the amount of rice available for Americans to eat has nearly doubled, from 11.6 to 21.2 pounds per person in 2010.
- In 2010, pineapples were America’s favorite canned fruit, and tomatoes were our favorite canned vegetable.
- U.S. milk availability, which peaked at 44.7 gallons per person in 1945, was 20.1 gallons per person in 2010.
Answers (all true) can be found in the Economic Research Service’s Food Availability (Per Capita) Data System—a unique data set revealing the types and amounts of food commodities available for U.S. consumers to eat.
Each year, my ERS colleagues and I calculate the available supply of several hundred foods, ranging from fresh and processed apples to frozen yogurt. We sum domestic production, beginning inventories, and imports, then subtract exports, ending inventories, and nonfood uses. Total annual supplies of each food are divided by the U.S. population for that year to come up with per capita estimates.
ERS’s food availability data include all food—whether consumers procure it from grocery stores, restaurants, school cafeterias, movie theaters, or other outlets. The data are collected from producers and industry sources rather than individual consumers. The consistent approach we use provides an historical view of the American diet—back to 1909 for many of the foods—and allows researchers to identify long-term consumption trends.
We recognize, of course, that supply or availability doesn’t always equal the amount eaten. Bones, peels, and other inedible parts are thrown away, spoilage losses occur throughout the marketing system, and not everything on the dinner plate makes it into our stomachs. For this reason, we calculate a second data series covering 1970 onward—Loss-Adjusted Food Availability—to account for spoilage and losses from farm to retail, at retail, and by consumers in homes and restaurants.
ERS is undertaking a multi-year effort to update and document the loss assumptions underlying this second data series. Losses at the consumer level from spoilage, cooking, and uneaten food or plate waste is the most recent piece to be updated. New loss adjustments for over 200 foods were included this year in our 1970-2010 loss-adjusted series. We encourage you to check out our extensive food availability data system.
This photo shows a loaf of bread sitting on top of a raw chicken. Food safety anyone?
Have no fear Dave, I am sure that after this photo was taken, most of this food was trashed.