


5.24.11

Spring 2011
How do we know when people are worried about inflation?
One way to gauge opinions on future inflation is to ask people directly, and several well-respected surveys do just that. The Reuters/University of Michigan Surveys of Consumers ask the proverbial “man on the street” how much he think prices will change in general terms, not relative to any statistic. Others, such as the Survey of Professional Forecasters or Blue Chip Economic Indicators, ask market professionals about specific measures, including their predictions for the CPI.

Another way to quantify inflation expectations is to see if people put their money where their mouth is. Several financial contracts linked to inflation provide a sense of what “the market” expects on the inflation front.
The most commonly used measure of inflation expectations of this type is the “break-even inflation rate” derived from the interest rates on two different types of Treasury securities. One type of Treasury bond, Treasury Inflation Protected Securities (TIPS), pays back more money if prices rise, and in that way protects against inflation. Traditional, or nominal, Treasury bonds do not—if the bond has a face value of $10,000, it will deliver $10,000 at maturity. A TIPS of equal face value, by contrast, will pay $11,000 if inflation runs at 10 percent over the life of the bond. Because one bond is protected against inflation and the other is not, the difference in their interest rates gives the measure of expected inflation at which an investor would “break even,” no matter which option was chosen.
Another way to gauge expectations is with something called an inflation swap. Here, two investors (or counterparties) agree to a trade: One side pays a fixed, certain interest rate, and the other agrees to pay whatever the inflation rate ends up being. So the fixed payment should indicate the investor’s expected inflation. In that sense, it is directly comparable to the break-even rate from TIPS.


Plotted on graphs in the first two figures, TIPS and inflation swaps show remarkably similar patterns, though liquidity and other differences between the instruments mean that they do not match exactly. After a large drop to abnormally low levels in the summer of 2010, expectations steadily increased back to levels somewhat above where they were in early 2010.
The problem with these indicators is that both the TIPS- and swaps-based measures overstate inflation expectations. Both include a risk premium for inflation along with a measure of expected inflation. That’s because investors demand a bit of insurance to account for the fact that inflation might differ from what they expect.
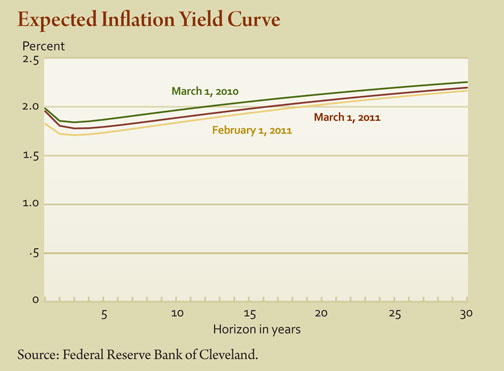
A measure developed at the Federal Reserve Bank of Cleveland uses a hybrid model that includes both financial data and survey measures of inflation to remove this bias. It delivers a purer measure of inflation expectations and can also extract inflation expectations at a variety of horizons. Shown in the bottom figure, this measure shows a fairly contained level of inflation at many horizons, with expectations generally staying below 2 percent for many years.