2007 ART Report Section 1-Overview
Explanation of Figures 1–4. Click on titles or images to go back to Section 1.
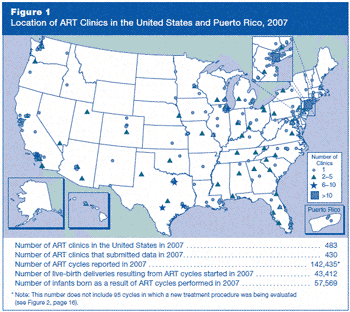
Figure 1: Where are U.S. ART clinics located, how many ART cycles did they perform in 2007, and how many infants were born?
Figure 1 is a map of the location of ART clinics in the United States and Puerto Rico, 2007.
There are five statistics listed at the bottom of the map:
- Number of ART clinics in the United States in 2007: 483
- Number of U.S. ART clinics that submitted data in 2007: 430
- Number of ART cycles reported in 2007: 142,435. Note: This number does not include 95 cycles in which a new treatment procedure was being evaluated.
- Number of live-birth deliveries resulting from ART cycles started in 2007: 43,412
- Number of infants born as a result of ART cycles performed in 2007: 57,569
Figure 2 is a pie chart representing the types of ART cycles in the United States, 2007.
- 6,130 frozen–donor cycles, 4.3%
- 11,275 fresh–donor cycles, 7.9%
- 23,133 frozen–nondonor cycles, 16.2%
- 101,897 fresh–nondonor cycles, 71.5%
- 95 cycles in which a new treatment procedure was being evaluated, <0.1%
Figure 3 is a pie chart representing ART use by age group in the United States, 2007.
- Age <35, 55,500 cycles, 39.0%
- Age 35–37, 31,175 cycles, 21.9%
- Age 38–40, 27,392 cycles, 19.2%
- Age 41–42, 13,574 cycles, 9.5%
- Age 43–44, 8,361 cycles, 5.9%
- Age >44, 6,433 cycles, 4.5%
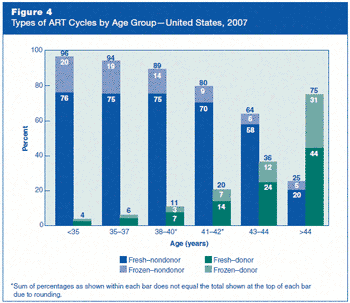
Figure 4 is a bar graph representing the types of ART cycles by age group in the United States, 2007.
- Age <35, Fresh–nondonor 76%, Frozen–nondonor 20%, Fresh–donor 2%, Frozen–donor 1% Note: Total does not equal 100% due to rounding.
- Age 35–37, Fresh–nondonor 75%, Frozen–nondonor 19%, Fresh–donor 4%, Frozen–donor 2%
- Age 38–40, Fresh–nondonor 75%, Frozen–nondonor 14%, Fresh–donor 7%, Frozen–donor 3%, Note: Sum of percentages as shown within each bar does not equal the total shown at the top of each bar due to rounding.
- Age 41–42, Fresh–nondonor 70%, Frozen–nondonor 9%, Fresh–donor 14%, Frozen–donor 7%, Note: Sum of percentages as shown within each bar does not equal the total shown at the top of each bar due to rounding.
- Age 43–44, Fresh–nondonor 58%, Frozen–nondonor 6%, Fresh–donor 24%, Frozen–donor 12%
- Age >44, Fresh–nondonor 20%, Frozen–nondonor 5%, Fresh–donor 44%, Frozen–donor 31%
Contact Us:
- Centers for Disease Control and Prevention
1600 Clifton Rd
Atlanta, GA 30333 - 800-CDC-INFO
(800-232-4636)
TTY: (888) 232-6348 - New Hours of Operation
8am-8pm ET/Monday-Friday
Closed Holidays - cdcinfo@cdc.gov


