Section 2: ART Cycles Using Fresh, Nondonor Eggs or Embryos (Part A)
Explanation of Figures 6–15. Click on titles or images to go back to Section 2 Part A.
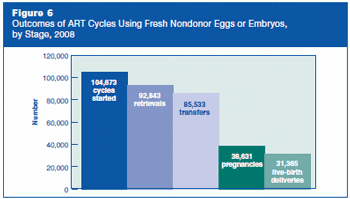
Figure 6 is a bar graph representing outcomes of ART cycles using fresh nondonor eggs or embryos, by stage, 2008.
- 104,673 cycles started
- 92,843 retrievals
- 85,533 transfers
- 38,631 pregnancies
- 31,365 live-birth deliveries
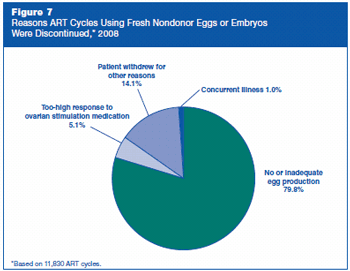
Figure 7 is a pie chart representing reasons ART cycles using fresh nondonor eggs or embryos were discontinued in 2008. Note: The statistics below are based on 11,830 ART cycles.
- No or inadequate egg production 79.8%
- Patient withdrew for other reasons 14.1%
- Too-high response to ovarian stimulation medication 5.1%
- Concurrent illness 1.0%
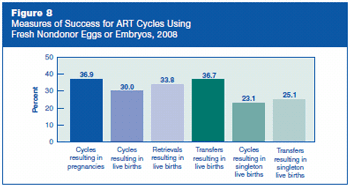
Figure 8 is a bar graph representing measures of success for ART cycles using fresh nondonor eggs or embryos, 2008.
- Cycles resulting in pregnancies 36.9%
- Cycles resulting in live births 30.0%
- Retrievals resulting in live births 33.8%
- Transfers resulting in live births 36.7%
- Cycles resulting in singleton live births 23.1%
- Transfers resulting in singleton live births 25.1%
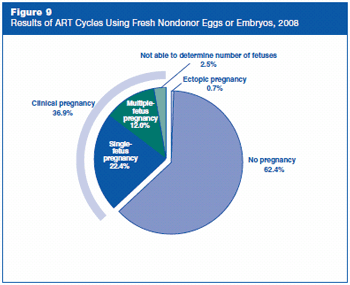
Figure 9 is a pie chart representing results of ART cycles using fresh nondonor eggs or embryos, 2008.
- No pregnancy 62.4%
- Ectopic pregnancy 0.7%
- Clinical pregnancy 36.9%, which is subdivided as follows:
- Single-fetus pregnancy 22.4%
- Multiple-fetus pregnancy 12.0%
- Not able to determine the number of fetuses 2.5%
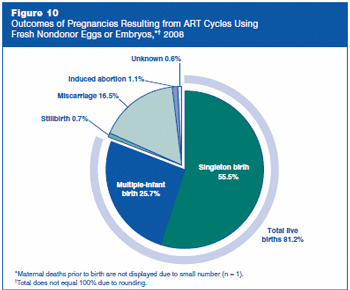
Figure 10: Outcomes of Pregnancies Resulting from ART Cycles Using Fresh Nondonor Eggs or Embryos, 2008.
Figure 10 is a pie chart representing outcomes of pregnancies resulting from ART cycles using fresh nondonor eggs or embryos, 2008. Note: Maternal deaths prior to birth are not displayed due to small number (n = 1). Total does not equal 100% due to rounding.
- Miscarriage 16.5%
- Induced abortion 1.1%
- Stillbirth 0.7%
- Total live births 81.2%, which is subdivided as follows:
- Singleton birth 55.5%
- Multiple-infant birth 25.7%
- Unknown outcome 0.6%
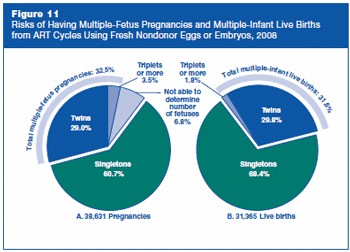
Figure 11: Risks of Having Multiple-Fetus Pregnancies and Multiple-Infant Live Births from ART Cycles Using Fresh Nondonor Eggs or Embryos, 2008.
Figure 11 consists of two pie charts, A and B, representing risks of having multiple-fetus pregnancies and the risks of having multiple-infant live births from ART cycles using fresh nondonor eggs or embryos, 2008.
- Pie chart A represents 38,631 pregnancies.
- Singletons 60.7%
- Total multiple-fetus pregnancies 32.5%, which is subdivided as follows:
- Twins 29.0%
- Triplets or more 3.5%
- Not able to determine the number of fetuses 6.8%
- Pie chart B represents 31,365 live births.
- Singletons 68.4%
- Total multiple-infant live births 31.6%, which is subdivided as follows:
- Twins 29.8%
- Triplets or more 1.8%
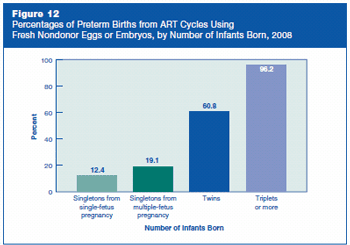
Figure 12: Percentages of Preterm Births from ART Cycles Using Fresh Nondonor Eggs or Embryos, by Number of Infants Born, 2008.
Figure 12 is a bar graph representing percentages of preterm births from ART cycles using fresh nondonor eggs or embryos, by number of infants born, 2008.
- 12.4% singletons from single-fetus pregnancy were preterm
- 19.1% singletons from multiple-fetus pregnancy were preterm
- 60.8% twins were preterm
- 96.2% triplets or more were preterm
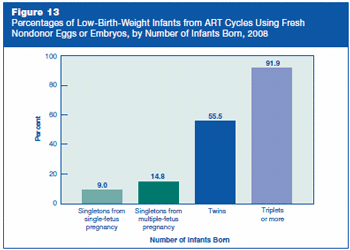
Figure 13: Percentages of Low-Birth-Weight Infants from ART Cycles Using Fresh Nondonor Eggs or Embryos, by Number of Infants Born, 2008.
Figure 13 is a bar graph representing percentages of low-birth-weight infants from ART cycles using fresh nondonor eggs or embryos, by number of infants born, 2008.
- 9.0% singletons from single-fetus pregnancy had low birth weights
- 14.8% singletons from multiple-fetus pregnancy had low birth weights
- 55.5% twins had low birth weights
- 91.9% triplets or more had low birth weights
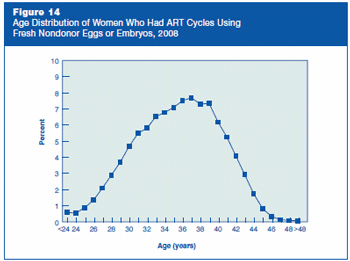
Figure 14 is a line graph representing the age distribution of women who had ART cycles using fresh nondonor eggs or embryos, 2008.
- Age <24, 0.60%
- Age 24, 0.55%
- Age 25, 0.89%
- Age 26, 1.35%
- Age 27, 2.10%
- Age 28, 2.90%
- Age 29, 3.71%
- Age 30, 4.68%
- Age 31, 5.49%
- Age 32, 5.81%
- Age 33, 6.52%
- Age 34, 6.78%
- Age 35, 7.09%
- Age 36, 7.50%
- Age 37, 7.69%
- Age 38, 7.30%
- Age 39, 7.34%
- Age 40, 6.18%
- Age 41, 5.25%
- Age 42, 4.09%
- Age 43, 2.93%
- Age 44, 1.76%
- Age 45, 0.84%
- Age 46, 0.35%
- Age 47, 0.15%
- Age 48, 0.10%
- Age >48, 0.07
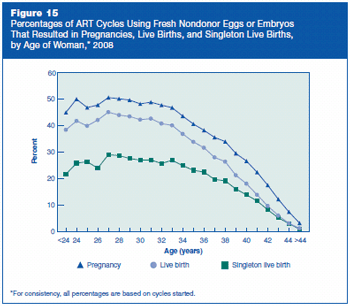
Figure 15: Percentages of ART Cycles Using Fresh Nondonor Eggs or Embryos That Resulted in Pregnancies, Live Births, and Singleton Live Births, by Age of Woman, 2008.
Figure 15 is a line graph with three lines representing percentages of ART cycles using fresh nondonor eggs or embryos that resulted in pregnancies, live births, and singleton live births, by age of woman, 2008. Note: For consistency, all percentages are based on cycles started.
- Age <24, Pregnancy 45.0%, Live birth 38.4%, Singleton live birth 21.7%
- Age 24, Pregnancy 50.0%, Live birth 41.8%, Singleton live birth 25.9%
- Age 25, Pregnancy 46.8%, Live birth 39.9%, Singleton live birth 26.4%
- Age 26, Pregnancy 47.8%, Live birth 42.1%, Singleton live birth 24.0%
- Age 27, Pregnancy 50.6%, Live birth 45.1%, Singleton live birth 29.1%
- Age 28, Pregnancy 50.1%, Live birth 44.0%, Singleton live birth 28.7%
- Age 29, Pregnancy 49.6%, Live birth 43.5%, Singleton live birth 27.6%
- Age 30, Pregnancy 48.2%, Live birth 42.3%, Singleton live birth 27.0%
- Age 31, Pregnancy 48.9%, Live birth 42.7%, Singleton live birth 27.1%
- Age 32, Pregnancy 47.7%, Live birth 40.8%, Singleton live birth 25.8%
- Age 33, Pregnancy 46.8%, Live birth 40.1%, Singleton live birth 27.0%
- Age 34, Pregnancy 43.6%, Live birth 36.9%, Singleton live birth 25.0%
- Age 35, Pregnancy 40.6%, Live birth 33.9%, Singleton live birth 23.2%
- Age 36, Pregnancy 38.3%, Live birth 31.7%, Singleton live birth 22.5%
- Age 37, Pregnancy 35.6%, Live birth 28.0%, Singleton live birth 19.8%
- Age 38, Pregnancy 34.0%, Live birth 26.4%, Singleton live birth 19.2%
- Age 39, Pregnancy 29.6%, Live birth 21.3%, Singleton live birth 16.2%
- Age 40, Pregnancy 26.7%, Live birth 18.1%, Singleton live birth 14.0%
- Age 41, Pregnancy 22.5%, Live birth 14.0%, Singleton live birth 11.7%
- Age 42, Pregnancy 17.6%, Live birth 9.8%, Singleton live birth 8.3%
- Age 43, Pregnancy 12.3%, Live birth 6.2%, Singleton live birth 5.3%
- Age 44, Pregnancy 7.5%, Live birth 3.2%, Singleton live birth 3.1%
- Age >44, Pregnancy 3.3%, Live birth 1.3%, Singleton live birth 1.0%
Contact Us:
- Centers for Disease Control and Prevention
1600 Clifton Rd
Atlanta, GA 30333 - 800-CDC-INFO
(800-232-4636)
TTY: (888) 232-6348 - New Hours of Operation
8am-8pm ET/Monday-Friday
Closed Holidays - cdcinfo@cdc.gov
