Section 2: ART Cycles Using Fresh, Nondonor Eggs or Embryos (Part B)
Click on titles or images to go back to Section 2 Part B.
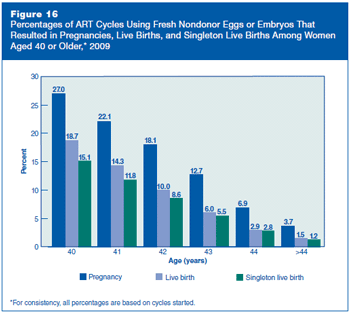
Figure 16: Percentages of ART Cycles Using Fresh Nondonor Eggs or Embryos That Resulted in Pregnancies, Live Births, and Singleton Live Births Among Women Aged 40 or Older, 2009.
Figure 16 is a bar graph representing percentages of ART cycles using fresh nondonor eggs or embryos that resulted in pregnancies, live births, and singleton live births among women aged 40 or older, 2009. Note: For consistency, all percentages are based on cycles started.
- Age 40, Pregnancy 27.0%, Live birth 18.7%, Singleton live birth 15.1%
- Age 41, Pregnancy 22.1%, Live birth 14.3%, Singleton live birth 11.8%
- Age 42, Pregnancy 18.1%, Live birth 10.0%, Singleton live birth 8.6%
- Age 43, Pregnancy 12.7%, Live birth 6.0%, Singleton live birth 5.5%
- Age 44, Pregnancy 6.9%, Live birth 2.9%, Singleton live birth 2.8%
- Age >44, Pregnancy 3.7%, Live birth 1.5%, Singleton live birth 1.2%
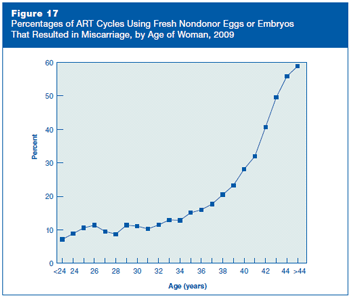
Figure 17: Percentages of ART Cycles Using Fresh Nondonor Eggs or Embryos That Resulted in Miscarriage, by Age of Woman, 2009.
Figure 17 is a line graph representing percentages of ART cycles using fresh nondonor eggs or embryos that resulted in miscarriage, by age of woman, 2009.
- Age <24, 7.2%
- Age 24, 8.9%
- Age 25, 10.6%
- Age 26, 11.4%
- Age 27, 9.5%
- Age 28, 8.7%
- Age 29, 11.4%
- Age 30, 11.1%
- Age 31, 10.3%
- Age 32, 11.5%
- Age 33, 13.0%
- Age 34, 12.8%
- Age 35, 15.1%
- Age 36, 16.0%
- Age 37, 17.7%
- Age 38, 20.5%
- Age 39, 23.3%
- Age 40, 28.1%
- Age 41, 31.9%
- Age 42, 40.7%
- Age 43, 49.5%
- Age 44, 55.8%
- Age >44, 58.8%
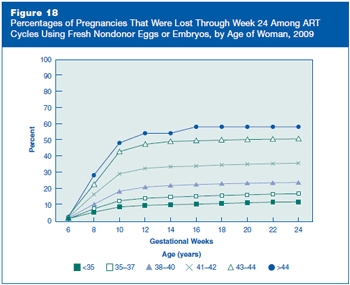
Figure 18: Percentages of Pregnancies That Were Lost Through Week 24 Among ART Cycles Using Fresh Nondonor Eggs or Embryos, by Age of Woman, 2009.
Figure 18 is a line graph with six lines representing percentages of pregnancies that were lost through week 24 among ART cycles using fresh nondonor eggs or embryos, by age of woman, 2009.
- Age <35, Gestational Week 6, 1.1%
- Age <35, Gestational Week 8, 5.1%
- Age <35, Gestational Week 10, 8.3%
- Age <35, Gestational Week 12, 9.3%
- Age <35, Gestational Week 14, 9.8%
- Age <35, Gestational Week 16, 10.1%
- Age <35, Gestational Week 18, 10.5%
- Age <35, Gestational Week 20, 11.0%
- Age <35, Gestational Week 22, 11.3%
- Age <35, Gestational Week 24, 11.5%
- Age 35–37, Gestational Week 6, 0.9%
- Age 35–37, Gestational Week 8, 7.2%
- Age 35–37, Gestational Week 10, 12.2%
- Age 35–37, Gestational Week 12, 13.7%
- Age 35–37, Gestational Week 14, 14.4%
- Age 35–37, Gestational Week 16, 15.0%
- Age 35–37, Gestational Week 18, 15.5%
- Age 35–37, Gestational Week 20, 15.9%
- Age 35–37, Gestational Week 22, 16.3%
- Age 35–37, Gestational Week 24, 16.5%
- Age 38–40, Gestational Week 6, 1.4%
- Age 38–40, Gestational Week 8, 10.0%
- Age 38–40, Gestational Week 10, 18.0%
- Age 38–40, Gestational Week 12, 20.6%
- Age 38–40, Gestational Week 14, 21.6%
- Age 38–40, Gestational Week 16, 22.2%
- Age 38–40, Gestational Week 18, 22.7%
- Age 38–40, Gestational Week 20, 23.0%
- Age 38–40, Gestational Week 22, 23.3%
- Age 38–40, Gestational Week 24, 23.5%
- Age 41–42, Gestational Week 6, 1.9%
- Age 41–42, Gestational Week 8, 16.1%
- Age 41–42, Gestational Week 10, 28.8%
- Age 41–42, Gestational Week 12, 32.2%
- Age 41–42, Gestational Week 14, 33.3%
- Age 41–42, Gestational Week 16, 33.6%
- Age 41–42, Gestational Week 18, 34.3%
- Age 41–42, Gestational Week 20, 34.8%
- Age 41–42, Gestational Week 22, 35.2%
- Age 41–42, Gestational Week 24, 35.5%
- Age 43–44, Gestational Week 6, 2.8%
- Age 43–44, Gestational Week 8, 22.3%
- Age 43–44, Gestational Week 10, 42.6%
- Age 43–44, Gestational Week 12, 47.1%
- Age 43–44, Gestational Week 14, 48.9%
- Age 43–44, Gestational Week 16, 49.3%
- Age 43–44, Gestational Week 18, 49.7%
- Age 43–44, Gestational Week 20, 50.1%
- Age 43–44, Gestational Week 22, 50.3%
- Age 43–44, Gestational Week 24, 50.5%
- Age >44, Gestational Week 6, 2.0%
- Age >44, Gestational Week 8, 28.0%
- Age >44, Gestational Week 10, 48.0%
- Age >44, Gestational Week 12, 54.0%
- Age >44, Gestational Week 14, 54.0%
- Age >44, Gestational Week 16, 58.0%
- Age >44, Gestational Week 18, 58.0%
- Age >44, Gestational Week 20, 58.0%
- Age >44, Gestational Week 22, 58.0%
- Age >44, Gestational Week 24, 58.0%
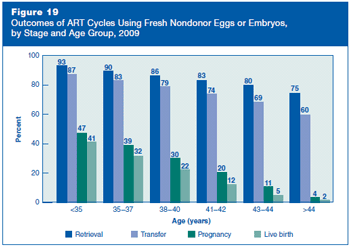
Figure 19: Outcomes of ART Cycles Using Fresh Nondonor Eggs or Embryos, by Stage and Age Group, 2009.
Figure 19 is a bar graph representing outcomes of ART cycles using fresh nondonor eggs or embryos, by stage and age group, 2009.
- Age <35, Retrieval 93%, Transfer 87%, Pregnancy 47%, Live birth 41%
- Age 35–37, Retrieval 90%, Transfer 83%, Pregnancy 39%, Live birth 32%
- Age 38–40, Retrieval 86%, Transfer 79%, Pregnancy 30%, Live birth 22%
- Age 41–42, Retrieval 83%, Transfer 74%, Pregnancy 20%, Live birth 12%
- Age 43–44, Retrieval 80%, Transfer 69%, Pregnancy 11%, Live birth 5%
- Age >44, Retrieval 75%, Transfer 60%, Pregnancy 4%, Live birth 2%
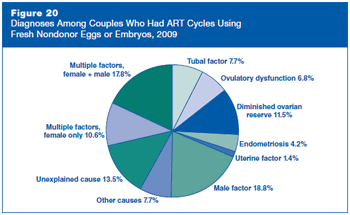
Figure 20 is a pie chart representing diagnoses among couples who had ART cycles using fresh nondonor eggs or embryos, 2009.
- Tubal factor, 7.7%
- Ovulatory dysfunction, 6.8%
- Diminished ovarian reserve, 11.5%
- Endometriosis, 4.2%
- Uterine factor, 1.4%
- Male factor, 18.8%
- Other causes, 7.7%
- Unexplained cause, 13.5%
- Multiple factors, female only, 10.6%
- Multiple factors, female + male, 17.8%
Figure 21: Percentages of ART Cycles Using Fresh Nondonor Eggs or Embryos That Resulted in Live Births, by Diagnosis, 2009.
Figure 21 is a bar graph representing percentages of ART cycles using fresh nondonor eggs or embryos that resulted in live births, by diagnosis, 2009.
- Tubal factor, 32.2%
- Ovulatory dysfunction, 40.4%
- Diminished ovarian reserve, 14.5%
- Endometriosis, 35.3%
- Uterine factor, 25.4%
- Male factor, 37.6%
- Other causes, 27.7%
- Unexplained cause, 33.7%
- Multiple factors, female only, 23.4%
- Multiple factors, female + male, 28.6%
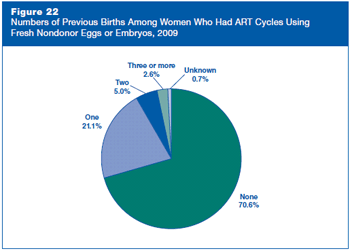
Figure 22: Numbers of Previous Births Among Women Who Had ART Cycles Using Fresh Nondonor Eggs or Embryos, 2009.
Figure 22 is a pie chart representing numbers of previous births among women who had ART cycles using fresh nondonor eggs or embryos, 2009.
- None, 70.6%
- One, 21.1%
- Two, 5.0%
- Three or more, 2.6%
- Unknown, 0.7%
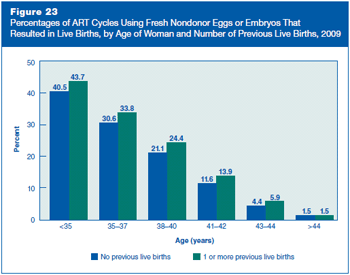
Figure 23: Percentages of ART Cycles Using Fresh Nondonor Eggs or Embryos That Resulted in Live Births, by Age of Woman and Number of Previous Live Births, 2009.
Figure 23 is a bar graph representing percentages of ART cycles using fresh nondonor eggs or embryos that resulted in live births, by age of woman and number of previous live births, 2009.
- Age <35, No previous live births 40.5%, 1 or more previous live births 43.7%
- Age 35–37, No previous live births 30.6%, 1 or more previous live births 33.8%
- Age 38–40, No previous live births 21.1%, 1 or more previous live births 24.4%
- Age 41–42, No previous live births 11.6%, 1 or more previous live births 13.9%
- Age 43–44, No previous live births 4.4%, 1 or more previous live births 5.9%
- Age >44, No previous live births 1.5%, 1 or more previous live births 1.5%
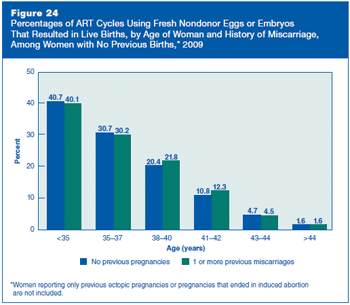
Figure 24: Percentages of ART Cycles Using Fresh Nondonor Eggs or Embryos That Resulted in Live Births, by Age of Woman and History of Miscarriage, Among Women with No Previous Births, 2009.
Figure 24 is a bar graph representing percentages of ART cycles using fresh nondonor eggs or embryos that resulted in live births, by age of woman and history of miscarriage, among women with no previous births, 2009. Note: Women reporting only previous ectopic pregnancies or pregnancies that ended in induced abortion are not included.
- Age <35, No previous pregnancies 40.7%, 1 or more previous miscarriages 40.1%
- Age 35–37, No previous pregnancies 30.7%, 1 or more previous miscarriages 30.2%
- Age 38–40, No previous pregnancies 20.4%, 1 or more previous miscarriages 21.8%
- Age 41–42, No previous pregnancies 10.8%, 1 or more previous miscarriages 12.3%
- Age 43–44, No previous pregnancies 4.7%, 1 or more previous miscarriages 4.5%
- Age >44, No previous pregnancies 1.6%, 1 or more previous miscarriages 1.6%
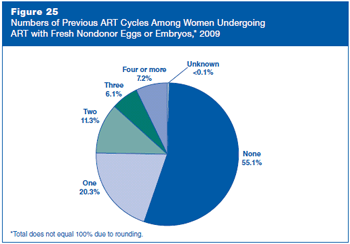
Figure 25: Numbers of Previous ART Cycles Among Women Undergoing ART with Fresh Nondonor Eggs or Embryos, 2009.
Figure 25 is a pie chart representing numbers of previous ART cycles among women undergoing ART with fresh nondonor eggs or embryos, 2009. Note: Total does not equal 100% due to rounding.
- None, 55.1%
- One, 20.3%
- Two, 11.3%
- Three, 6.1%
- Four or more, 7.2%
- Unknown, <0.1%
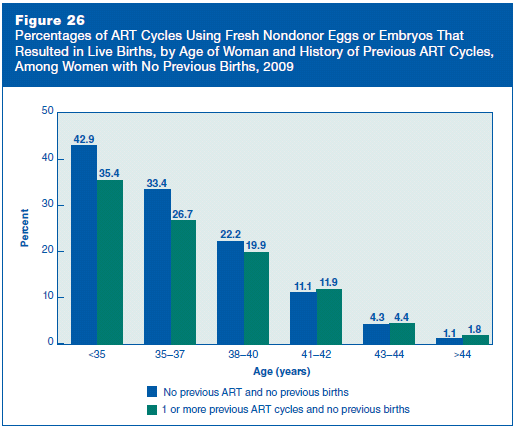
Figure 26: Percentages of ART Cycles Using Fresh Nondonor Eggs or Embryos That Resulted in Live Births, by Age of Woman and History of Previous ART Cycles, Among Women with No Previous Births, 2009.
Figure 26 is a bar graph representing percentages of ART cycles using fresh nondonor eggs or embryos that resulted in live births, by age of woman and history of previous ART cycles, among women with no previous births, 2009.
- Age <35, No previous ART and no previous births 42.9%, 1 or more previous ART cycles and no previous births 35.4%
- Age 35–37, No previous ART and no previous births 33.4%, 1 or more previous ART cycles and no previous births 26.7%
- Age 38–40, No previous ART and no previous births 22.2%, 1 or more previous ART cycles and no previous births 19.9%
- Age 41–42, No previous ART and no previous births 11.1%, 1 or more previous ART cycles and no previous births 11.9%
- Age 43–44, No previous ART and no previous births 4.3%, 1 or more previous ART cycles and no previous births 4.4%
- Age >44, No previous ART and no previous births 1.1%, 1 or more previous ART cycles and no previous births 1.8%
Contact Us:
- Centers for Disease Control and Prevention
1600 Clifton Rd
Atlanta, GA 30333 - 800-CDC-INFO
(800-232-4636)
TTY: (888) 232-6348 - New Hours of Operation
8am-8pm ET/Monday-Friday
Closed Holidays - cdcinfo@cdc.gov
