
Survey of Business Owners (SBO)
You are here: Census.gov › Business & Industry › Economy-Wide Statistics › Survey of Business Owners › Ownership Characteristics of Classifiable U.S. Exporting Firms: 2007
Ownership Characteristics of Classifiable U.S. Exporting Firms: 2007
Survey of Business Owners Special Report
Issued June 2012
Download [pdf, 8.6M] | Highlights | Appendix TablesABOUT THIS REPORT
This first-ever report describes findings from the merging of two Census Bureau data products, the 2007 Profile of U.S. Exporting Companies (the Profile) and the 2007 Survey of Business Owners (SBO). The Profile is an annual database of commingled U.S. exports and business characteristics, compiled from Electronic Export Information filed through the Automated Export System, received from Canada through the Data Exchange, or by paper Shipper's Export Declarations. The SBO, part of the Census Bureau's five-yearly Economic Census, provides the only comprehensive, regularly collected source of information on selected economic and demographic characteristics of U.S. businesses and their owners by gender, ethnicity, race, and veteran status.
The merged data from the 2007 Profile and the 2007 SBO provide new insights on the ownership and performance of U.S. exporting firms. This report focuses on the characteristics of "classifiable firms," businesses whose ownership is classifiable by their gender, ethnicity, race, and veteran status.1
FINDINGS
Classifiable firms accounted for the bulk of U.S. exporters, but a much smaller share of U.S. export value.
In 2007, 163,419 classifiable U.S. nonfarm businesses exported goods worth $169.7 billion. Classifiable firms accounted for 82.5 percent of matched exporting firms (i.e., firms linked to specific export transactions), but only 17.6 percent of these firms' total export value.
Average export value per firm for classifiable exporters was $1.0 million; the comparable estimate for publicly owned exporters and exporters not classified by gender, ethnicity, race, and veteran status was $22.9 million.
Relatively few classifiable U.S. firms were exporters, but exporters were much larger in terms of receipts and employment, and more productive, than nonexporters.
In 2007, classifiable exporting firms accounted for only 0.6 percent of the 26.3 million classifiable U.S. nonfarm businesses, but they accounted for a quarter (25.1 percent or $2.8 trillion) of all classifiable businesses' total receipts ($10.9 trillion). (See Appendix Table 1.)
Average receipts per firm for classifiable exporting firms were $16.8 million compared with $313,689 for classifiable nonexporting firms.
In 2007, almost two-thirds (65.9 percent) of classifiable exporting firms had gross receipts of more than $1 million. In contrast, only 4.3 percent of classifiable nonexporting firms had gross receipts of more than $1 million.
In 2007, classifiable exporting firms accounted for only 2.9 percent of all classifiable employer2 firms, but they accounted for 15.0 percent (8.5 million) of these firms' employees and 19.6 percent ($380.0 billion) of their total annual payroll. The average number of employees for classifiable exporting firms was 56; the comparable number for classifiable nonexporting firms was 10. (See Appendix Table 16.)
Average productivity for classifiable exporting employer firms (i.e., receipts per employee) was $323,897; the comparable calculation for classifiable nonexporting employer firms was $150,946.
Minority-Owned Firms3
Minority-owned exporting firms were larger than their nonexporting minority-owned counterparts in terms of receipt size and employment. Average receipts for minority-owned exporting firms were $7.4 million; for minority-owned nonexporting firms, $141,776.
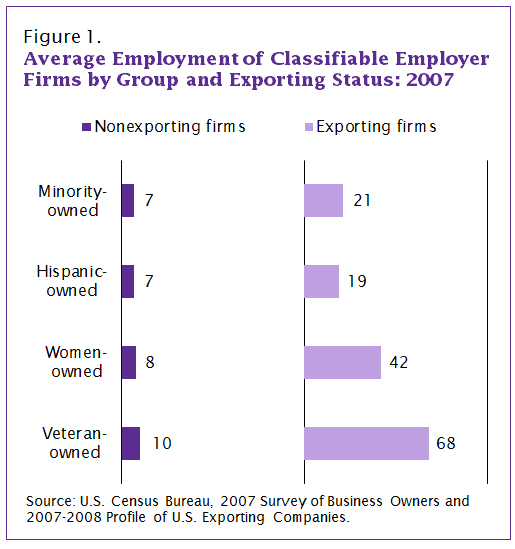
The average number of employees for minority-owned exporting employer firms was 21; the comparable number for minority-owned nonexporting employer firms was 7. (See Figure 1.) Average productivity for minority-owned employer exporters (i.e., receipts per employee) was $407,592; the comparable calculation for minority-owned employer nonexporters was $122,545.
Hispanic-Owned Firms
Average receipts for Hispanic-owned exporting firms were $7.2 million compared with $124,418 for Hispanic-owned nonexporting firms.
The average number of employees for Hispanic-owned exporting employer firms was 19; the comparable number for Hispanic-owned nonexporting employer firms was 7.
Average productivity for Hispanic-owned employer exporters (i.e., receipts per employee) was $443,632; the comparable calculation for Hispanic-owned employer nonexporters was $119,869.
Women-Owned Firms
Average receipts for women-owned exporting firms were $14.5 million compared with $117,036 for women-owned nonexporting firms.
The average number of employees for women-owned exporting employer firms was 42; the comparable number for women-owned nonexporting employer firms was 8.
Average productivity for women-owned employer exporters (i.e., receipts per employee) was $389,757; the comparable calculation for women-owned employer nonexporters was $107,288.
Veteran-Owned Firms
Average receipts for veteran-owned exporting firms were $19.5 million compared with $371,143 for veteran-owned nonexporting firms.
The average number of employees at veteran-owned exporting employer firms was 68; the comparable number for veteran nonexporting employer firms was 10.
Average productivity for veteran-owned employer exporters (i.e., receipts per employee) was $303,037; the comparable calculation for veteran-owned employer nonexporters was $170,393.
Minority-owned firms accounted for a disproportionately small share of exporters relative to their numbers, but exports accounted for a larger percentage of the receipts of minority-owned exporters than for nonminority-owned exporters.
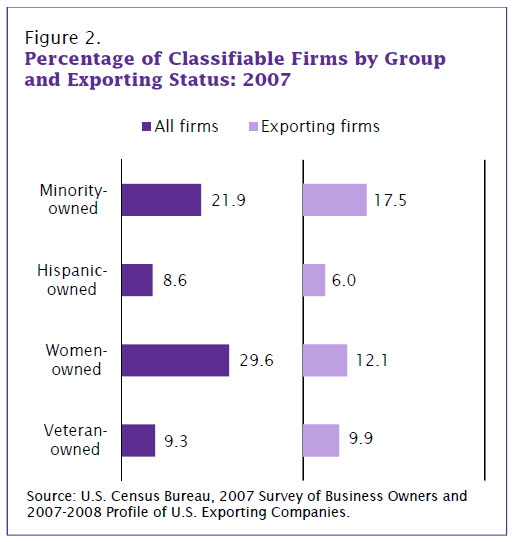
In 2007, minority-owned firms (5.8 million) made up 21.9 percent of all classifiable firms (26.3 million), but the 28,531 minority-owned exporters accounted for only 17.5 percent of classifiable exporting firms (163,419). (See Figure 2.)
In 2007, exports accounted for 14.4 percent of total receipts ($212.3 billion) of minority-owned exporters compared with 5.4 percent of total receipts ($2.5 trillion) for nonminority-owned exporters.
Women-owned firms accounted for a disproportionately small share of exporters relative to their numbers; women-owned exporters also had lower average export value than men-owned exporters.
In 2007, women-owned firms (7.8 million) made up 29.6 percent of all classifiable firms (26.3 million), but the 19,739 women-owned exporters accounted for only 12.1 percent of classifiable exporting firms (163,419).
Average export value for women-owned exporting firms was $766,748 compared with $1.2 million for men-owned exporting firms.
Veteran-owned firms exported at a rate commensurate with their numbers.
In 2007, 16,246 veteran-owned exporters accounted for 9.9 percent of all classifiable exporters (163,419). This is similar to the proportion of veteran-owned firms (9.3 percent or 2.4 million) to all classifiable firms (26.3 million). Exports accounted for 4.9 percent of total receipts for veteran-owned exporters compared with 6.3 percent of total receipts for nonveteran-owned exporters.
Among classifiable firms that exported in 2007, minority-owned firms targeted different markets than their nonminority peers, increasing the global reach of U.S. businesses.
In 2007, average export value for Hispanic-owned exporting firms to the 20 Latin American countries4 was $1.1 million. Nonminority-owned exporting firms' average export value to the same countries was $553,725.
Trade with these 20 Latin American countries accounted for 81.1 percent of the total export value accounted for by Hispanic-owned exporting firms. The corresponding number for nonminority-owned exporting firms was 15.1 percent.
In 2007, average export value for Asian-owned exporting firms to Pacific Rim countries5 was $1.3 million, while average export value to the same region by nonminority-owned firms was $651,264.
Trade with the Pacific Rim countries accounted for 56.9 percent of the total export value generated by Asian-owned exporting firms; the corresponding number for nonminority-owned firms was 21.9 percent.
HOW IS FIRM OWNERSHIP DETERMINED FOR THIS REPORT?
The SBO asked for demographic information for up to four owners owning the largest percentages of the business. Firm ownership was determined based on the groups for which there was a 51% or greater ownership percentage. For example, firms were classified as minority-owned if one or more Hispanic, Black or African American, American Indian and Alaska Native, Asian, Native Hawaiian and Other Pacific Islander, or Some Other Race owners owned 51% or more of the business.
CONTACT INFORMATION
For additional information about this special report, please call 888.225.4022 (toll free), or e-mail csd.sbo@census.gov.
For additional information on Survey of Business Owners data, please visit www.census.gov/sbo, call 888.225.4022 (toll free), or e-mail csd.sbo@census.gov.
For additional information on the Profile of U.S. Exporting Companies and other foreign trade data, please visit www.census.gov/foreign-trade, call 800.549.0595 (toll free), or e-mail ftdwebmaster@census.gov.
APPENDIX TABLES
Each table includes two parts: estimates are in part "a"; standard errors and relative standard errors for the estimates are in part "b."
Return to the top of this page. ↩
The official estimate of U.S. exports in 2007 was $1.162 trillion (U.S. Census Bureau, "A Profile of U.S. Exporting Companies, 2007-2008"). Of that total, about $1.034 trillion was attributable to “identified exporters,” specific companies to which the Census Bureau was able to match specific export transactions. In 2007, there were 268,526 identified exporters.
About 67,000 identified exporters (with about $92 billion in exports) were out-of-scope to the SBO or did not match to the SBO universe. These included firms without reported sales, payroll, and employment; firms operating primarily in out-of-scope industries, such as crop and animal production; and firms located in American Samoa, the Commonwealth of the Northern Mariana Islands, Guam, Puerto Rico, and the U.S. Virgin Islands.
The remaining 201,000 identified exporters were subject to SBO sampling. Of these companies, about 198,000 (weighted) were selected into the SBO sample. All estimates in this report are based on these sampled identified exporters. Estimated total exports for these sampled identified exporters were $963 billion. Estimated total exports by publicly held and other unclassifiable firms were $793 billion. Estimated total exports for classifiable firms were $170 billion.
| Exporting firms (number) | Export value ($ billions) | |
|---|---|---|
| Official exports (2007) | X | 1,162 |
| Identified exporters from the Profile | 268,526 | 1,034 |
| Identified exporters out-of-scope to the SBO | 67,349 | 92 |
| Identified exporters matched to the SBO universe | 201,177 | 942 |
| Identified exporters matched to the SBO sample (weighted) | 198,081 | 963 |
| "Classifiable firms" (i.e., firms classifiable by gender, ethnicity, race, and veteran status) | 163,419 | 170 |
| Publicly held and other firms not classifiable by gender, ethnicity, race, and veteran status | 34,662 | 793 |
2 Employer firms are firms with payroll at any time during 2007.
3 See "How Is Firm Ownership Determined for This Report?"
4 Includes Argentina, Bolivia, Brazil, Chile, Colombia, Costa Rica, Cuba, Dominican Republic, Ecuador, El Salvador, Guatemala, Haiti, Honduras, Mexico, Nicaragua, Panama, Paraguay, Peru, Uruguay, and Venezuela.
5 Includes Australia, Brunei, China, Hong Kong, Indonesia, Japan, South Korea, Macao, Malaysia, New Zealand, Papua New Guinea, Philippines, Singapore, and Taiwan.
[Excel] or the letters [xls] indicate a document is in the Microsoft® Excel® Spreadsheet Format (XLS). To view the file, you will need the Microsoft® Excel® Viewer
The letters PPT indicate a document is in the Microsoft® PowerPoint® Format (PPT). To view the file, you will need the Microsoft® PowerPoint® Viewer
This symbol
 Facebook
 Twitter
 Flickr
 YouTube