Policy Impact: Teen Driver Safety
What's the Issue?
Motor vehicle crashes are the leading cause of death for U.S. teens. In 2009, about 3,000 teens in the United States ages 15 to 19 were killed, and in 2008 more than 350,000 were treated in emergency departments for injuries suffered in motor vehicle crashes.1,2
In one year alone, crash-related injuries and deaths among teens ages 15 to 19 cost $14 billion in medical care and productivity losses.3
Teen motor vehicle crashes are preventable. There are proven policies to improve the safety of young drivers on the road.
What Do We Know?
Among all age groups, teen drivers are at the greatest risk. Per mile driven, teen drivers are four times more likely than adult drivers to crash.4 Factors that contribute to teen crashes and injuries include the following:
- Driver inexperience: Crash rates are highest during the first year a teen has a license.4
- Driving with teen passengers: Crash risk goes up when teens drive with other teens in the car. The risk increases with each additional passenger.5
- Nighttime driving: For all ages, fatal crashes are more likely to occur at night, but the risk is highest for teens.6
- Not wearing seat belts: Compared with other age groups, teens have the lowest rate of seat belt use.7
- Distracted driving: Distractions – such as talking or texting on cell phones, eating, or playing with the radio – increase teen drivers’ risk of being in a crash.8
In 2009, eight teens a day died from motor vehicle crashes.
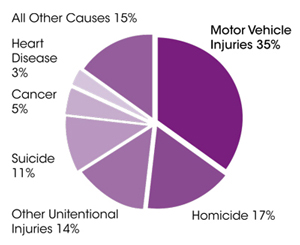
Motor Vehicle Crashes are the Leading Cause of Death for Teens
(ages 15-19, 2007)1
Younger Drivers Have More Crashes9

What Can We Do?
Graduated driver licensing (GDL) systems are proven effective in keeping teens safe on the road. They help new drivers gain experience under low-risk conditions by granting driving privileges in stages. As teens move through the stages of GDL, they are given extra privileges, such as driving at night or driving with passengers.
Research indicates that the most comprehensive GDL systems prevent crashes and save lives.10 While most states have a three-stage GDL system, rules and requirements vary considerably. States can best protect their teens by putting strong three-stage GDL systems in place.
We can do more to keep teen drivers safe. Existing policies can be strengthened and made more comprehensive, and new policies can be proposed. Improving policies will prevent crashes and safeguard teens and other road users from needless injuries and deaths.
If every state had a strong GDL policy, we could save 175 lives and prevent about 350,000 injuries each year.
CDC Recommendations
 Graduated driver licensing policies that include a three-stage system:
- Learner’s permit
- 16-years-old as the minimum age.
- Mandatory holding period of at least six months.
- Probationary license
- No unsupervised nighttime driving from at least 10:00 pm to 5:00 am.
- Limit the number of teen passengers that may accompany a teen driver without adult supervision to zero or one (not including family members).
- Full license
- 18-years-old as the minimum age.
Prohibit cell phone use (talking and texting) for teenage drivers.
Allow teenage drivers to be stopped and ticketed if they or their passengers are not wearing seat belts. This is known as a primary enforcement seat belt law.
Vigorously enforce zero tolerance policies for underage drinking and driving. A zero tolerance law makes it illegal for a person under the age of 21 to drive with any measurable amount of alcohol in their blood.
How State GDL Systems Measure Up
The Insurance Institute for Highway Safety ranks state licensing systems for young drivers, giving points for key components of GDL.11 Even in states ranked “good,” there is still room for improvement.
See alphabetical listing of states with rankings for licensing systems.

References
- Centers for Disease Control and Prevention. Web-based Injury Statistics Query and Reporting System (WISQARS) [Online] 2010. National Center for Injury Prevention and Control, Centers for Disease Control and Prevention. Available from URL: www.cdc.gov/injury/wisqars.
- National Highway Traffic Safety Administration. Fatality Analysis Reporting System (FARS) [Online] 2009. National Center for Statistics and Analysis, National Highway Traffic Safety Administration. Available from URL: www-fars.nhtsa.dot.gov/Main/index.aspx.
- Naumann RB, Dellinger AM, Zaloshnja E, Lawrence BA, Miller TR. Incidence and Total Lifetime Costs of Motor Vehicle-Related Fatal and Nonfatal Injury by Road User Type, United States, 2005. Traffic Injury Prevention 2010;11(4):353-360.
- Insurance Institute for Highway Safety (IIHS). Fatality facts: Teenagers 2008. Arlington (VA): The Institute; 2009. Available from URL: www.iihs.org/research/fatality_facts_2008/teenagers.html.
- Chen L, Baker SP, Braver ER, Li G. Carrying passengers as a risk factor for crashes fatal to 16- and 17-year old drivers. JAMA 2000;283(12):1578-82.
- Centers for Disease Control and Prevention. Youth Risk Behavior Surveillance—United States, 2007 [Online]. (2009). National Center for Chronic Disease Prevention and Health Promotion (producer). Available from URL: www.cdc.gov/mmwr/preview/mmwrhtml/ss5704a1.htm.
- National Highway Traffic Safety Administration. Safety Belt Use in 2008—Demographic Results. Based on the 2008 National Occupant Protection Use Survey [online]. Available from URL: http://www-nrd.nhtsa.dot.gov/Pubs/811183.PDF
- National Highway Traffic Safety Administration. Statistics and Facts about Distracted Driving. Based on the 2008 National Occupant Protection Use Survey [online]. Available from URL: www.distraction.gov/stats-and-facts/#what.
- Williams AF. Teenage drivers: Patterns of risk. Journal of Safety Research 2003;34:5-15.
- Baker SP, Chen L, Li G. Nationwide review of graduated driver licensing. Washington (DC): AAA Foundation for Traffic Safety; 2007.
- Insurance Institute for Highway Safety. Licensing Ages and Graduated Licensing Systems. August 2010. Available from URL: http://www.iihs.org/laws/pdf/us_licensing_systems.pdf.
Policy Impact is a series of issue briefs from CDC’s Injury Center highlighting key public health issues and important, science-based policy actions that can be taken to address them.
Get email updates
To receive email updates about this page, enter your email address:
Contact Us:
- Centers for Disease Control and Prevention
National Center for Injury Prevention and Control (NCIPC)
4770 Buford Hwy, NE
MS F-63
Atlanta, GA 30341-3717 - 800-CDC-INFO
(800-232-4636)
TTY: (888) 232-6348
New Hours of Operation:
8am-8pm ET/
Monday-Friday
Closed Holidays - cdcinfo@cdc.gov