Federal Reserve Economic Data
Download, graph, and track
61,000 US and international time series from 48 sources.
FRED News Features
1 Series from the Chicago Fed National Financial Conditions Index Added to FRED
posted on Dec 10
16 Series from the ADP National Employment Report Added to FRED
posted on Nov 29
Update of Daily and Weekly Treasury Inflation-Indexed Securities Delayed
posted on Nov 19
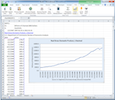
 Download our new Excel add-in to quickly access and manipulate more than 55,000 data series. Select data by the specific data series ID or from a list of FRED’s most popular datasets. Create graphs and perform data manipulations with the add-in’s customization tools. When new data are released, quickly update your previously developed spreadsheets with the click of a button.
 rollover graph icon for an expanded view


