Genes and Variation
Step 1: Introduction
This tutorial walks you through the steps of analyzing variation, such as SNPs, annotated in a region of interest. The steps include
- Finding a region of interest using the Search function
- Using zoom functions to display the sequence and annotated variation
- Using zoom functions to zoom out to define a region of interest
- Selecting a set of annotated variant sites (rs numbers)
- Generating a report of those variants
- Exporting the selected set of variants to web-based tools provided by dbSNP
- Re-setting the orientation and numbering system in a region of interest
This tutorial assumes you've completed Tutorial 1: Basic Operation first.
Step 2: Opening Screen
When Genome Workbench starts up, the main application window will appear; it looks like the image below.
The function on the main application window that we will use to begin this tutorial is Search View. If it's not visible when Genome Workbench starts, you can access it by clicking the binoculars icon on the toolbar or choosing Tools -> Search from the main menu.
Step 3: Using Search to Find a Gene
Genome Workbench does not require that you determine in advance the chromosome coordinates of the genome you want to review. All you need to know is a unique attribute, such as a symbol or GenBank ID associated with the gene's record in Entrez Gene. With that in hand, you can do your searching within Genome Workbench. If you are already a power user of NCBI's Entrez system, you will find your favorite queries work in Genome Workbench because the Entrez search syntax is supported. In this example, we will use LPA AND human[organism]. human[organism] is added to the query to restrict the results to genes from humans. Note that the AND operator MUST be in uppercase.
There are several pull-down menus in the Search View. The first gives you several choices from which to search. For this example, select Search NCBI Public Databases from the Search Tool menu. Select Entrez Gene as the NCBI Database and enter the phrase:
LPA AND human[organism]
in the search box. Press enter or click Start. Your screen should now display the results of your search. If you cannot see the results, drag the line over Search View up until they are displayed.
Step 4: Selecting a gene and adding a project
The results of your search are displayed. When you have identified the gene you want to display (in this case LPA), left click to highlight the row and then right click anywhere on that row to open the contextual menu and choose Add to Project.
Step 5: Creating a project and naming the folder
The Add to Project dialog box is then displayed. For your first query, you should retain the default choices of Create a new Project.
Click on OK in the dialog box to proceed to the next step.
You can rename the project by right clicking (control-click for the MacOS) on LPA and choosing Properties and editing the name.
Step 6: Creating a view of a gene and its sequence
After you add a project, you can see the results in the Project Tree View, which is docked at the left.
The next step will be to open a view of the project information. You can either:
- Right-click (control-click in the MacOS) on the data (LPA[Homo sapiens) and choose Open View
- Double click on the data (LPA[Homo sapiens])
- Select (single click) on the data (LPA[Homo sapiens]) and choose View -> Open View... from the main menu.
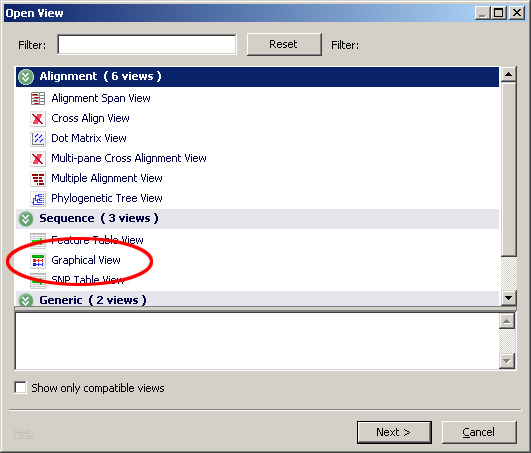
All these options will open the Open View Dialog where you should select the graphical view.
Step 7: Selecting the sequence to display in the graphical view
The Graphical View dialog box displays a listing of the various contexts in which this gene (LPA) can be shown. Clicking on the All Conversions select box will limit the list to specific subsets such as:
- Genomic Locations...Chromosomes, Contigs
- Product Locations...mRNA and Protein sequences
- RefSeq Sequences....NM_ and NP_
- Related Sequences...GenBank accessions
For the purpose of this tutorial select the chromosome record NC_000006 from the list and press the Finish button.
Step 8: Components of the Graphical display of a gene region.
A new window is opened in the main display area with a graphical veiw of the LPA gene on the human chromosome 6 as shown. The Graphical View allows you to turn on additional data tracks.
Click on the content drop down and the bottom of the view and choose SNP and STS.
Now the Graphical View has many elements including a ruler shown at the top followed by a gray bar representing the genomic sequence, a SNP density map (small tick marks), blue bar representing the contigs, a green bar for the gene a blue bar for the mRNA sequence and a red bar for the protein sequence and sequence tag sites are shown as black tick marks. Tool tip text boxes containing additional information appear when you hover your mouse over these elements. The LPA gene is in reverse orientation to the chromosome in this view as indicated by the arrows in the green bar pointing to the left.
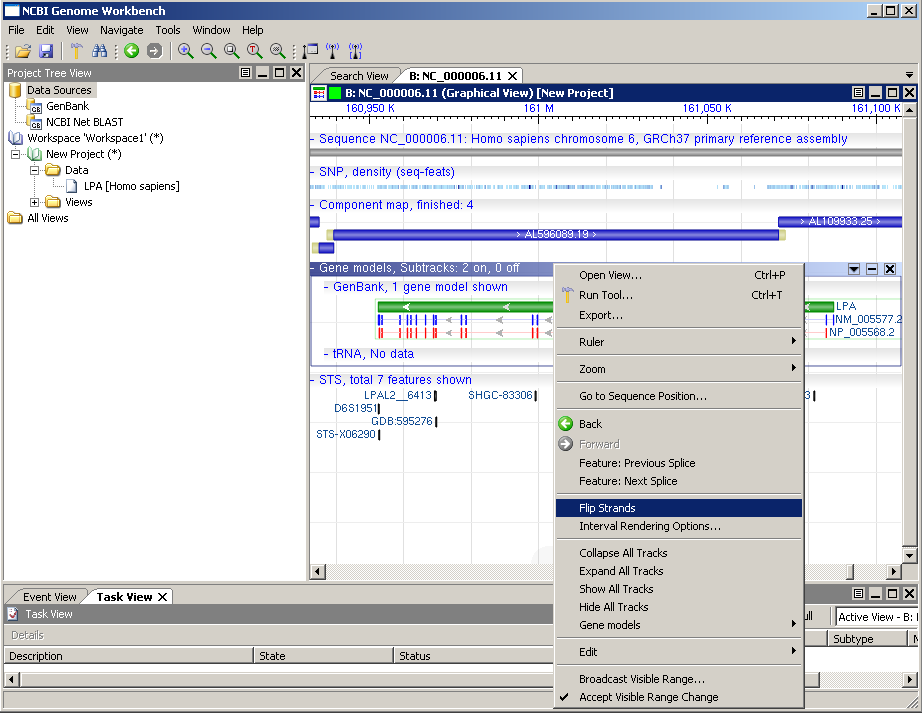 Before continuing let's flip the strand viewed by the graphical viewer by right clicking on the gene area and selecting the flip strands option.
The next steps will show you ways to zoom the display to see the sequence context of specific variation(s).
Step 9: Select a region and zoom options
Sequence regions can be selected in the graphical view by clicking and dragging in the ruler section at the top of the display. The selected area(s) will appear as a gray shaded area that spans the display vertically. Select an area that includes four exons of the LPA gene centered on position -161,050k, your display should look like the picture below.
There are several different options to adjust the magnification or "zoom" of the region displayed in the Graphical View. Zoom options by clicking on icons on the main toolbar:
- The zoom in and zoom out options for small adjustments
- The zoom to sequence option displays the sequence bases, "all the way in"
- The zoom to all option, zooms "all the way out"
- The zoom to selection option, to zoom in to a selected area
Continuous zooming is also supported by holding the "Z" key on the keyboard and either the right mouse button and moving mouse, or rolling the mouse wheel.
And by holding the "R" key while clicking and dragging, one can zoom in on a region
Panning, or moving left and right, is accomplished by clicking in white space and dragging the mouse.
Take a few moments to now to try the various zoom functions. The back and forward arrows icons located on the menu are also available for quick adjustment of zoom levels. Zoom to the selection area described above to continue this tutorial.
Step 10: Display a list of SNPs in my selected region
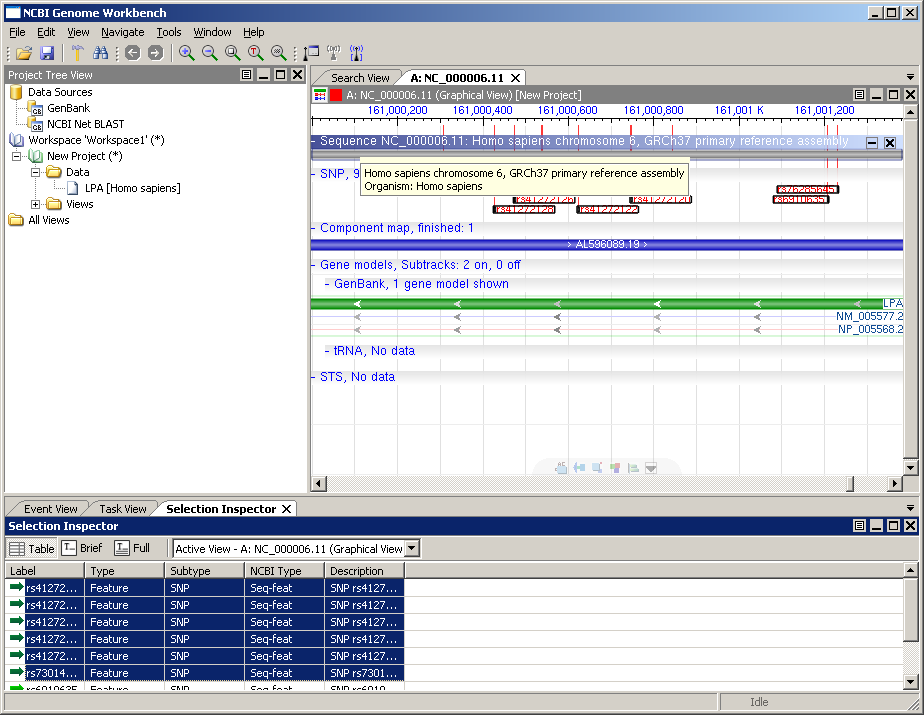
Components of the graphical view that have been selected are listed in the Selection Inspector window. To view a list of known variations:
- Select the option Selection Inspector from the menu item View.
- Zoom in so you can see the labels on individual SNPs
- Select a few. Hold the control key and click to select more than one feature. -or-
- Hold the shift key and drag a marquee around several SNPs. This can be a bit tricky.
- The SNP's will then appear in the selection inspection window. In the picture below.
The next step of this tutorial will demonstrate how to get information by linking out from Genome Workbench to a dbSNP web page.
Step 11: Linkout to Reference SNP (rs) page or the Genotype report
Each Variation (rs) shown in the Graphical View has a vast array of associated data cataloged in the dbSNP database. Genome Workbench links directly to the dbSNP Refsnp rs cluster report. To open a Refsnp rs cluster report:
- Highlight SNP or SNPs in the Selection Inspector.
- Right click (control click on the MacOS) and select Open View
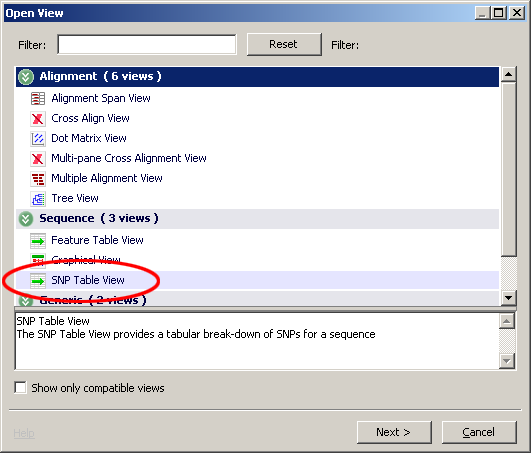
- Choose SNP Table View
- Choose the SNPs of interest and click finish. One SNP table view will be create for each SNP.
From the SNP Table view (shown below) right click on the SNP of interest and choose RefSNP Link from the contextual menu and you'll be taken to a dbSNP cluster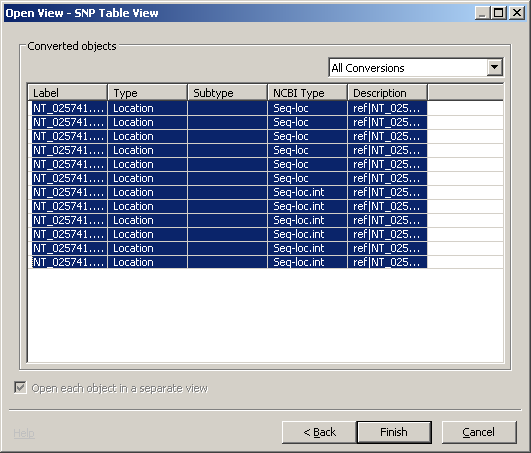 report.
Download
Current Version is 2.6.0 (released August 31, 2012)
- Release Notes
- Windows
- Mac OS X
- Linux (Ubuntu 10.04 LTS (Lucid Lynx))
- Source
- Older Versions


