USGS - science for a changing world

Wyoming Water Science Center FloodWatch
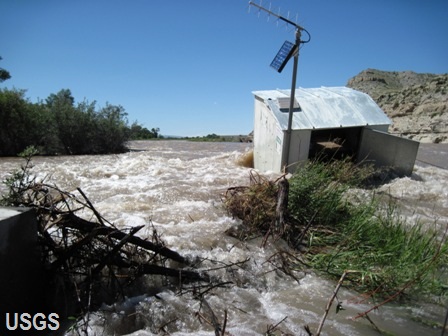
  home   information/data   projects   publications   drought   flood  wlci   nawqa   links  contact

Picture of flooding on the Wind River, Wyoming.

DATA CENTER

USGS IN YOUR STATE

USGS Water Science Centers are located in each state.

There is a USGS Water Science Center office in each State. Washington Oregon California Idaho Nevada Montana Wyoming Utah Colorado Arizona New Mexico North Dakota South Dakota Nebraska Kansas Oklahoma Texas Minnesota Iowa Missouri Arkansas Louisiana Wisconsin Illinois Mississippi Michigan Indiana Ohio Kentucky Tennessee Alabama Pennsylvania West Virginia Georgia Florida Caribbean Alaska Hawaii New York Vermont New Hampshire Maine Massachusetts South Carolina North Carolina Rhode Island Virginia Connecticut New Jersey Maryland-Delaware-D.C.

Wyoming FloodWatch

Floods in Wyoming have caused millions of dollars damage and loss of life. Nationwide, floods are responsible for more property damage and loss of life than any other natural hazard. The USGS monitors flood conditions at more than 100 streamgages across Wyoming. Water level and flow information are used by the National Weather Service to make accurate flood forecasts. Included on this page are links to maps, tables, and charts that summarize current flood conditions using real-time data from USGS streamgages, photographs of current and historic flooding, information on mobile applications for real-time USGS streamflow data, links to USGS flood publications and other resources for flood information.

Current Flood and High Flow Data

Flood Tracking Charts


Flood Tracking Charts depict current, recent, and historic maximum stage or discharge (important information about FTCs). Updated charts for selected USGS streamgages in Wyoming are grouped by the following basins:
| Wind | Bighorn | Tongue | Powder | Cheyenne | Belle Fourche | Upper North Platte | Lower North Platte | Green | Bear | Snake |

Flood and High Flow Pics

    New2012 Water Year
  • 06313590 Powder R ab Burger Dr nr Buffalo WY (Mar 7 2012: est 1,240 ft3/s; mean = 201 ft3/s) | Pic | Pic by J. Swanson USGS
  • 06426500 Belle Fourche R nr Moorcroft WY (Mar 8 2012: 1,500 ft3/s; mean = 52 ft3/s) | Pic 1 | Pic 2 | Pics by E. Blajszczak USGS
  • 06317020 Wild Horse Cr nr Arvada WY (Mar 9 2012: 175 ft3/s; mean = 11 ft3/s) | Pic | Pic by E. Blajszczak USGS
  • 06317000 Powder R at Arvada WY (Mar 9 2012: measurement not possible; mean = 312 ft3/s) | Pic | Pic by E. Blajszczak USGS

Flood Apps & Pubs

  • USGS WaterAlert: Real-time water data texted or emailed to you!
  • USGS StreaMail: Text or email a USGS streamgage!
  • 100-year flood--Its all about chance | Poster |
  • Peak-flow characteristics of Wyoming streams | Report |
  • Flood hazards--A National threat | Fact Sheet |
  • Flood management benefits of USGS streamgaging program--National Hydrologic Warning Council | Report (4.3 MB) |

Historical Floods

  • Flood of August 1, 1985 in Cheyenne, Wyoming | Atlas |
  • Floods of May 1978 in southeastern Montana and northeastern Wyoming | Report | Data |
  • Reports about historical floods in Wyoming | Bibliography |
  • 1976 Big Thompson flood, Colorado--Thirty years later | Summary | Fact Sheet (6.4 MB) |
  • The 1972 Black Hills-Rapid City flood revisited | Web Page | Fact Sheet (5.6 MB) |
  • Large floods in the United States: Where they happen and why | Summary | Report (7.3 MB) |
  • The world's largest floods, past and present: Their causes and magnitudes | Summary | Report (0.8 MB) |

Flood Links

The map below (from USGS's WaterWatch Web site) shows the location of USGS streamgages in Wyoming currently at or above flood stage (depicted as a black triangle) or at high flow (depicted as blue circles). High flow conditions are expressed as percentiles comparing current (within the past several hours) instantaneous flow to historical daily mean flow for all days of the year. Flood stages are determined by the National Weather Service; not all USGS streamgages have flood stages. A depiction of other streamgages at or above flood stage is on the NWS River Conditions Map. Real-time data are provisional and subject to change.

Map of Flood and High-Flow Conditions in Wyoming.

Map of flood and high flow condition.

Map legend for below normal 7-day average streamflow condition map

View a larger map.

Rainfall Calculator

Find out how many gallons of water falls on an area when it rains.

All the water in floods comes from the sky—but have you ever wondered just how many gallons of water falls on an area when it rains? You might be surprised at how much water comes down. Use our Water Science rainfall calculator to see how many gallons of water falls from the sky during a rainstorm.

Historical flood photograph
^ Bighorn River at entrance to Hot Springs State Park,
Thermopolis, WY, July 24, 1923.
Maximum discharge: 29,800 ft3/s.

USGS Home Water Climate Change Core Science Ecosystems Energy&Env. Health Hazards

Accessibility FOIA Privacy Policies and Notices

Take Pride in America logo USA.gov logo U.S. Department of the Interior | U.S. Geological Survey
URL: http://wy.water.usgs.gov/flood/index.htm
Page Contact Information: webmaster_wy
Page Last Modified: Friday, 11-Jan-2013 13:12:45 EST