Rapid Growth Doesn’t Necessarily Trump a Big Population Base
Written by: Elizabeth M. Grieco and Christine Gambino
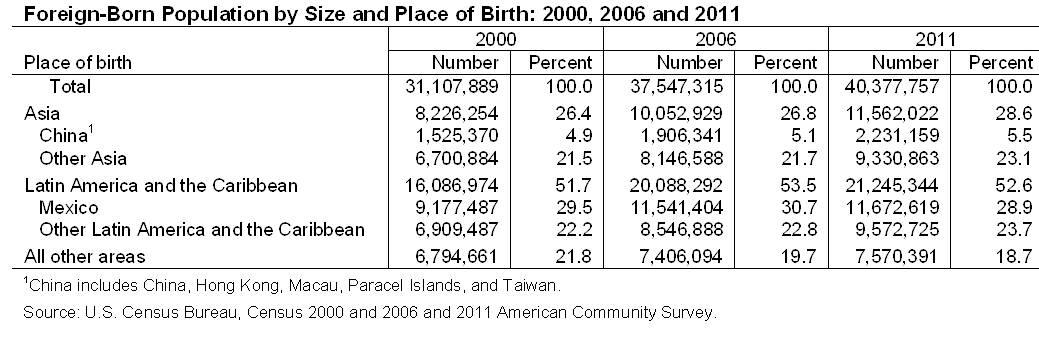
The foreign-born population from Asia increased over the last decade – from 8.2 million in 2000 to 11.6 million in 2011 – and now represents more than one-fourth (29 percent) of all immigrants in the United States.
While sizeable, the foreign-born population from Asia is still smaller than the number of foreign born from Latin America and the Caribbean. As of 2011, there were 21.2 million foreign-born from Latin America and the Caribbean, up from 16.1 million in 2000. More than half (53 percent) of today’s foreign-born population is from Latin America and the Caribbean.
Mexico has remained the largest single country-of-birth group throughout the decade, increasing from 9.2 million in 2000 to 11.7 million in 2011. Currently, the foreign-born from Mexico represents 29 percent of the total foreign-born population. By comparison, the next largest country-of-birth group – the foreign-born from China – accounts for 6 percent of all foreign-born.

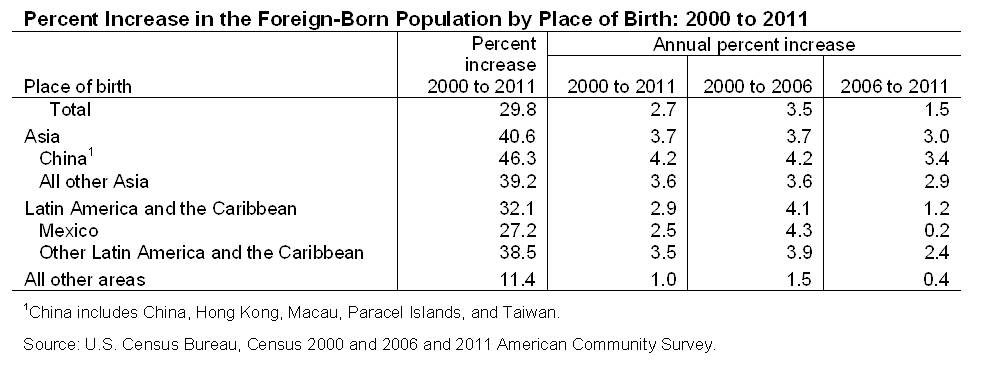
 Since 2000, the foreign-born population from Asia has grown at a faster rate than the foreign-born population from Latin America and the Caribbean. Between 2000 and 2011, the foreign-born from Asia grew by 41 percent, or 3.7 percent each year. During this same period, the foreign-born from Latin America and the Caribbean increased by 32 percent, or 2.9 percent each year.
For both region-of-birth groups, there were notable differences in the rates of change between the earlier and latter half of the period, with growth slowing considerably during the last five years. Between 2000 and 2006, the foreign-born population from Asia increased 3.7 percent per year, declining to 3.0 percent per year between 2006 and 2011. The foreign-born population from Latin America and the Caribbean increased 4.1 percent per year between 2000 and 2006, dropping to 1.2 percent between 2006 and 2011.
The decline in growth rate of the foreign-born population from Latin America and the Caribbean is largely attributable to the remarkable change in growth rate for the foreign born from Mexico in the latter half of the 2000 to 2011 period. Between 2000 and 2006, the foreign-born population from Mexico increased by 4.3 percent per year. Between 2006 and 2011, the size of the annual increase dropped to less than one-half of 1 percent per year.
Despite the faster rate of growth for the foreign born from Asia in recent years, the size of the foreign-born population from Latin America and the Caribbean will likely remain larger than the foreign-born population from Asia in the near future. Patterns of immigration and emigration between the United States and any region of the world can – and frequently do – change quickly, so it is unclear if the relatively low growth rates seen in the last 5-6 years for some region and country-of-birth groups will continue in the long term.
But what will happen if the foreign-born population from Asia continues to grow at the same higher rate over the next few decades, while the foreign-born from Mexico increases at the same lower rate? Will the foreign-born population from Asia (11.6 million in 2011) grow larger than the population from Latin America and the Caribbean (21.2 million in 2011)?
Even if growth rates stayed the same as those seen in the past 5-6 years, it would take much longer than a few decades for that to happen. Due to its much larger population base in 2011, the foreign-born population from Latin America and the Caribbean will remain the largest region-of-birth group for the foreseeable future. Nevertheless, it will be interesting to see how growth patterns change over coming decades and affect the relative size of the populations from Asia, Latin America and the Caribbean, and other regions.


