Questions & Answers
Information on 2009 H1N1 impact by Race and Ethnicity
This website is archived for historical purposes and is no longer being maintained or updated. For updated information on the 2011-2012 flu season, see the CDC Seasonal Flu website.
February 24, 2010 2:00 PM ET
This page provides summary information about the impact of 2009 H1N1 across racial and ethnic groups in the United States. This information was reported to CDC through the Emerging Infections Program from April 15, 2009 through January 26, 2010, and through the Behavioral Risk Factor Surveillance System (BRFSS) 2009 H1N1 Flu Modules for Influenza-like Illness (ILI) from September 1 to December 31, 2009. Preliminary information about race/ethnicity and 2009 H1N1 was first reported at the Advisory Committee on Immunization Practices meeting of October 22, 2009 (slides 45-49).
How does CDC collect data on the race and ethnicity of people hospitalized with 2009 H1N1 flu?
CDC collects data on 2009 H1N1-related hospitalizations through the Emerging Infections Program (EIP) and Aggregate Hospitalization and Deaths Reporting Activity (AHDRA). Of the two systems, however, EIP is the only one that routinely captures information related to race/ethnicity. EIP conducts weekly surveillance for laboratory-confirmed influenza related hospitalizations in children (people younger than 18 years) and adults in over 60 counties covering 13 metropolitan areas of 10 states. EIP identifies influenza-related hospitalizations by reviewing hospital laboratory and admission databases and infection control logs for children and adults with a positive influenza test conducted as a part of routine patient care. The chart review process also collects data on the race and ethnicity of hospitalized flu patients.
What races and ethnicities have been most affected in terms of hospitalizations related to 2009 H1N1 according to EIP?
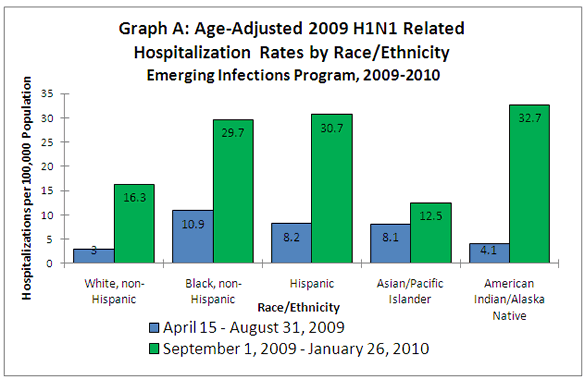
EIP hospitalization data collected from April 15– August 31, 2009 and from September 1, 2009 - January 26, 2010 show that minority groups have been more heavily impacted by 2009 H1N1 than non-minority groups. Most recently, American Indians/ Alaska Natives have been hospitalized more than any other group, followed by Hispanics, and then Black, non-Hispanics. White, non-Hispanics and Asian/Pacific Islanders had significantly fewer hospitalizations from 2009 H1N1 influenza than the other races or ethnicities. See Graph A below for a visual representation of the races and ethnicities of hospitalized patients with 2009 H1N1 infections in the United States, as reported through EIP from April 15– August 31, 2009 and from September 1, 2009-January 26, 2010.
Was there a change in race and ethnicity patterns of hospitalized 2009 H1N1 patients from the spring-summer of 2009 to the fall-winter outbreak (September 2009 to January 2010)?
When comparing hospitalization rates across racial/ethnic groups during the spring-summer versus the fall-winter, it’s clear that minority groups have consistently had higher rates of serious 2009 H1N1 disease, including hospitalizations, than non-minority groups. In fact, hospitalization rates among minority groups have consistently been more than double those of White, non Hispanics. In the spring, Black, non-Hispanics were the most hospitalized race while White, non-Hispanics were the least hospitalized race. In the fall-winter wave of 2009 H1N1 activity, American Indians/ Alaska Natives emerged as a seriously impacted group, but other minority groups, including Hispanics, and Black, non-Hispanics had higher hospitalization rates in both the spring-summer and the fall-winter than White, non-Hispanics. See Graph A below to see the comparison between spring-summer 2009 data (April 15-August 31, 2009) and 2009-2010 (September 1, 2009-January 26, 2010) influenza season data.

Why have minorities been more seriously impacted by 2009 H1N1 in terms of hospitalizations than non-minorities?
The reasons for this disparity are unknown at this time. The 2009 H1N1 pandemic consisted largely of focal, urban outbreaks of disease. It’s possible that socio-economic reasons could account for the differences in 2009 H1N1 hospitalization rates by race/ethnicity, including issues related to access to care, preponderance of underlying health conditions among certain ethnic or minority groups and self care or care seeking behaviors.
What about reports of influenza-like illness associated with the 2009 H1N1 pandemic?
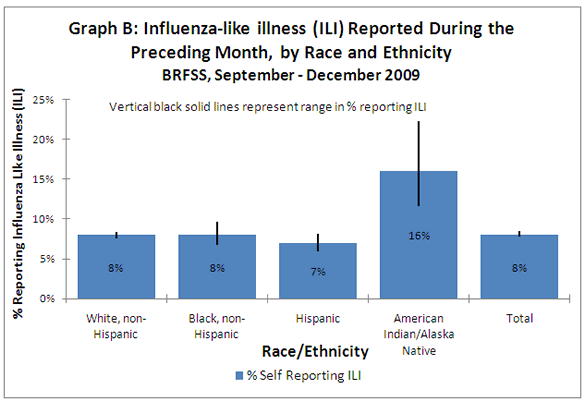
The Behavioral Risk Factor Surveillance System (BRFSS) also is collecting information related to race and ethnicity during this pandemic. BRFSS is a telephone-based system of health surveys run by states that collect information on health risk behaviors, preventive health practices, and health care access primarily related to chronic disease and injury. CDC is responding to 2009 H1N1 influenza by implementing BRFSS modules related to influenza-like illness (ILI) in 49 states, DC, Puerto Rico, and the Virgin Islands. Graph B, below, shows BRFSS data from interviews conducted September through December 2009 by the race and ethnicities of people who reported influenza-like illness (ILI) within a month prior to the interview. The pattern of data related to self-reported ILI is somewhat different from the EIP hospitalization data. According to the survey data, 8% of all respondents reported ILI. Among the racial and ethnic groups, the percentage of self-reported ILI was similar among non-Hispanic white respondents, non-Hispanic black respondents, and Hispanic respondents but was higher among American Indian and Alaska Natives.

Has health care seeking behavior varied by race/ethnicity during the 2009 H1N1 pandemic?
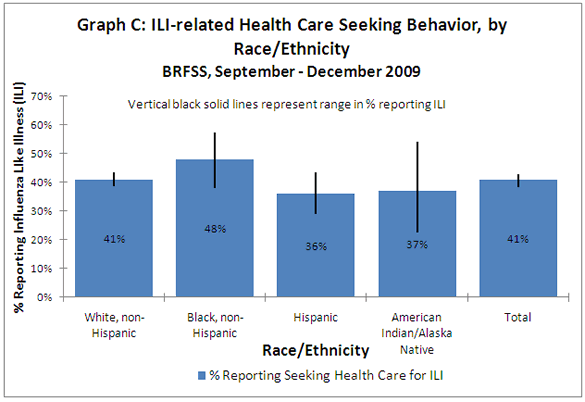
Graph C, below, shows BRFSS data on people who reported seeking health care for influenza like illness (ILI) by race and ethnicity from interviews conducted September through December 2009. According to the survey data, 43% of respondents reported seeking health care for their ILI. The percentage of respondents who sought medical care for ILI was similar among all respondents, including non-Hispanic white respondents, non-Hispanic black respondents, Hispanic respondents, and American Indian and Alaska Natives.

Get email updates
To receive weekly email updates about this site, enter your email address:
Contact Us:
- Centers for Disease Control and Prevention
1600 Clifton Rd
Atlanta, GA 30333 - 800-CDC-INFO
(800-232-4636)
TTY: (888) 232-6348
24 Hours/Every Day - cdcinfo@cdc.gov


