Mapping Slavery

Edwin Hergesheimer. “Map Showing the Distribution of the Slave Population of the Southern States of the United States Compiled from the Census of 1860.” Washington: Henry S. Graham 1861. Geography and Map Division.

According to the 1860 census, the population of the United States that year was 31,429,891. Of that number, 3,952, 838 were reported as enslaved. The 1860 census was the last time the federal government took a count of the Southern slave population. In 1861, the United States Coast Survey issued two maps of slavery based on the census data: the first mapped Virginia and the second mapped Southern states as a whole.

The landmark map of the Southern states provided a graphic breakdown of those census returns, specifically focusing on slave population per county as a percentage of the total population in the southern portion of the nation. Using statistical cartography, low percentages were shown in light grey while higher percentages were illustrated using more intense shading. This provided a dramatic representation of slavery across the region. The counties along the Mississippi River and in coastal South Carolina show the highest percentage of slaves, while Kentucky and the Appalachians show the lowest.

According to Susan Schulten, history department chair at the University of Denver, the map reaffirmed the belief of many in the Union that secession was driven not by a notion of “states’ rights,” but by the defense of a labor system. A table at the lower edge of the map measured each state’s slave population, and contemporaries would have immediately noticed that this corresponded closely to the order of secession. However, the map also illustrated the degree to which entire regions – like eastern Tennessee and western Virginia – were largely absent of slavery and thus potential sources of resistance to secession.

(Schulten spoke about the map at a Library of Congress symposium last year. You can view the webcast here.)

The Southern stages slavery map is a featured item in the “The Civil War in America” exhibition, opening next month, and has never before been displayed by the Library to the public.

This map was, by some accounts, consulted by Abraham Lincoln throughout the course of the Civil War. It even appears in the famous 1864 painting of the president and his cabinet, titled “First Reading of the Emancipation Proclamation by President Lincoln,” by artist Francis Bicknell Carpenter — a print of which is in the Library’s collections.

Next Wednesday’s post will be the final spotlight on items from the exhibition. You can read about others in these previous blog posts:

Dear Diary

A Presidential Fundraiser

A Letter Home

A Grief Like No Other

The Bull Run of the West

Countdown to Book-Stravaganza

Just days stand between the book-lovers of the USA and the Library of Congress National Book Festival! But don’t just stare at the countdown clock on the Festival website … check out the speaking and book-signing schedules for our 125 authors, or listen to the podcasts already available from some of this year’s authors.  That …

Read more »

Let the Games Begin!

Tonight the 2012 Olympics in London kick off. The excitement has certainly been building all year as enthusiasts have followed the torch relay and participating athletes and teams. I can admit that the games probably appeal to me for a few other different reasons than purely anticipating all the awesome competition. First, my favorite band, …

Read more »

Legal Cleanup on Aisle 4!

If someone set a bowl of cheese curls in front of you and declared it “breakfast,” would you be able to discern it from cereal? Even if you’re the type who likes cold pizza at 7 a.m., odds are you would not be too quick to pour on the milk and dive in with a …

Read more »

The View From 30,000 … Maps!

This is a guest post by Donna Urschel of the Library’s Public Affairs Office. If you’ve ever wondered where you are, or where you might be going, know this: if you have access to a computer, the Library of Congress now has 30,000 maps online to guide you. In the basement level of the Library’s …

Read more »

Gateway to Knowledge Guest Post #7

This is the seventh in a series of guest posts by Abigail Van Gelder, who with her husband, Josh, is journeying across the country on the Library’s “Gateway to Knowledge” traveling exhibition: We knew that Oberlin, OH was going to be a special event.  Oberlin College is the alma mater of Emily Rapoport—who, with her …

Read more »

Gateway to Knowledge Guest Post #5.1

This is one of a series of guest posts by Abigail Van Gelder, who with her husband, Josh, is journeying across the country on the Library’s “Gateway to Knowledge” traveling exhibition: Congressman Charlie Wilson from Ohio stopped by to welcome guests to the Gateway To Knowledge exhibit on its first day in Marietta; he was joined …

Read more »

New Optical Lab Brings LOC into 21st Century

(The following is a guest article about new preservation capabilities at the LOC by my colleague Donna Urschel, which was recently published in the the Library’s staff newsletter, the Gazette.)

Library of Congress Optical Properties Lab

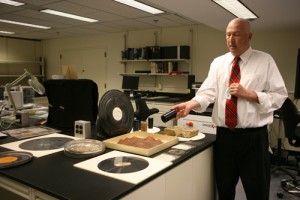
Preservation Research Chief Eric Hansen explains how equipment is used to capture sound from damaged audio recordings. (Abby Brack photo)

For many decades, details of the 1791 Pierre L’Enfant Plan of Washington, D.C.—one of the many treasures at the Library of Congress—had been obscured. A long-ago application of a varnish preservative had darkened the map’s surface. But today, thanks to special imaging techniques, the invisible streets and special locations, including the “President’s House” and “Congress’ House,” pop out.

Hyperspectral imaging, a process of taking digital photos of an object using distinct portions of the light spectrum, is revealing what previously could not be seen by the human eye.

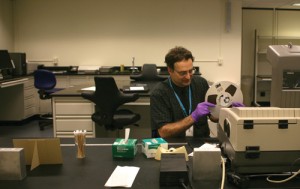
In room 27 on the sub-basement level of the James Madison Building, fascinating details of our historical heritage are coming to light in the recently opened Optical Properties Laboratory. Operated by the Library’s Preservation Research and Testing Division (PRTD) in the Preservation Directorate, the lab contains a hyperspectral imaging system, an environmental scanning electron microscope (ESEM), equipment for optical disc quality testing and a Fourier Transform Infrared Spectroscopy (FTIR) system.

The new lab enhances the Library’s capability to use nondestructive analytical techniques to track changes in optical properties of materials, helping conservators, curators and librarians extend the life of the collections. Along the way, many interesting details about the documents are revealed.

The Optical Properties Lab is one of three new labs in the Preservation Directorate. Two more will open in the Madison Building in 2010: the Chemical and Physical Properties laboratories. The new equipment and redesigned space will bring the 30-year-old science labs of the Preservation Directorate into the 21st century.

20091203_lab_002

Stephen Hobaica in the Library’s Preservation, Research and Testing lab tests for chemical markers of degradation of magnetic media. (Abby Brack photo)

Read more »

O Shenandoah, I Long to Map You

In a world where we can keep tabs on our own backyards from our desks at work, via satellite, it’s difficult to imagine the impact one man armed with notebooks and pencils could have in 1861 as the Civil War began to rend our young nation.  Generals on both sides of that conflict desperately needed good topographical information …

Read more »