Online Exhibition
All images in this exhibition are reproduced online with
the permission of the American Congress of Surveying and
Mapping, unless otherwise noted.
Surveying
Mr. Clifton's Neck Land becomes George Washington's "River
Farm"
George Washington, the first
president of the United States, was trained as a surveyor
and practiced in western Virginia in the early years of his
career. In 1760 and 1766, he prepared two manuscript plats
of land he had recently purchased, later known as the River
Farm, adjacent to his ancestral home of Mount Vernon. These
two maps are examples of colonial-era plantation maps.
|

A
plan of Mr. Clifton's neck land platted at a scale of
50 poles to the inch by TH 1755 & copied by GW, 1760.
Geography and Map
Division (1)
[Digital ID# ct000473]
|

George Washington (1732-1799).
A plan
of my farm on Little Hunting Creek & Potomack
River, [1766]. Geography
and Map Division (2)
[Digital ID# ct000085]
|

George Washington (1732-1799).
A map
of General Washington's farm of Mount Vernon from a drawing
transmitted by the General.
Geography and Map
Division (2A)
[Digital ID# ct000367]
|
Mount Vernon and River Farm,
1793
Over the course of his life, Washington transformed Mount
Vernon from a simple homestead to an 8,000-acre working plantation.
Washington exchanged nearly thirty letters with Arthur Young,
a British agricultural supporter, in an attempt to refine
and improve his farming methods. This map, originally prepared
in 1793, documents Washington's five farms (Union, Dogue
Run, Muddy Hole, Mansion House, and River Farm) and the crops
under cultivation on each.
|
Mount Vernon and River Farm, 1859
Following Washington's death in 1799, the Mount Vernon estate
was divided among Washington's heirs. This map, intended
to show land ownership rather than accurately delineated
boundary lines, is based on a combination of previous plats
and surveys performed in the 1850s.
|

W. Gillingham.
Map
of George Washington's Land at Mount Vernon, Fairfax County,
Virginia, 1850.
Geography and Map
Division (3)
[Digital ID# ct001459]
|

Plat
Showing Property of Col. Jas. A. Drain,
Fairfax County, Virginia,
1920.
Alexandria, Virginia: Fairfax County Land Archives (4)
This image is reproduced online with the permission of R.C.
Fields and Associates
[Digital ID# ctr00014]
|
A Partial View of Washington's River Farm,
1920
Eventually, much of the land owned by George Washington
transferred to other owners. This item is a map of a portion
of Washington's River Farm based on a survey by Joseph Berry,
whose plats have served as a basis for many of the modern
surveys in Fairfax County, and documents boundary lines for
a conveyance of two parcels to Colonel James A. Drain. This
survey is among the first subdivisions of this parcel that
was once part of George Washington's estate.
|
A Partial View of Washington's River Farm, 1937
Land transactions and subdivision of existing parcels are
typically accompanied by plats documenting the new boundary
lines. This plat, based on a 1937 survey by Lincoln Mackey,
shows a portion of Col. James A. Drain's property depicted
in the 1920 plat.
|

Plat
of Part of the Property of Col. James A. Drain, Fairfax
County, Virginia,
January 9, 1937.
Alexandria, Virginia: Fairfax County Land Records Archives
(5)
This image is reproduced online with the permission of R.C.
Fields and Associates
[Digital ID# ctr00015]
|
Record
Plat of Riverview at Mount Vernon, Mt. Vernon District, Fairfax
County, Virginia,
May 1, 1995.
Alexandria, Virginia: R.C. Fields, Jr. and Associates, 1995
(6)
This image is reproduced online with the permission of R.C.
Fields and Associates
[Digital ID# ctr00011]
|
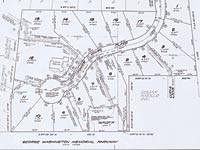
A Partial View of Washington's River Farm,
1995
Created in 1995 in accordance with Fairfax County, Virginia
regulations, this plat documents the further subdivision
of a portion of Col. James A. Drain's parcel. By the end
of the twentieth century, technological advancements in both
measurement and cartography, along with time-honored evidence
analysis procedures, led to the creation of more accurate
and detailed plats.
|
A Partial View of Washington's River Farm, 1999
Owners of individual parcels or subdivided lots may use
survey plats in conjunction with obtaining a mortgage, selling
the property, or obtaining a building permit for improvements.
This map is an example of the further subdivision of a lot
created by the 1995 plat and represents the further evolution
of survey plats.
|

Plat
Showing Resubdivision of Lot 12, Riverview at Mount Vernon,
Mt. Vernon District, Fairfax County, Virginia, November 5,
1999.
Alexandria, Virginia: R.C. Fields, Jr. and Associates, 1999
(7)
This image is reproduced online with the permission of R.C.
Fields and Associates
[Digital ID# ctr00012]
|

Ortho
Map.
Fairfax County, Virginia: Department of Information Technology,
Geographic Information System (GIS) and Mapping Services,
2004 (8)
[Digital ID# ctr00016]
|
An Orthophotographic Map
Orthophotographic maps are created by modifying traditional
aerial photographs and may be especially useful for viewing
physical features of large geographic areas. This map gives
an overview of the vicinity of the Col. James A. Drain property,
once George Washington's River Farm, depicted in the preceding
items.
|
Video
Maps In Our Lives -
Requires free RealOnePlayer from www.real.com
Running Time: 2 minutes
Produced by: Environmental Systems Research Institute,
Inc.
The following maps are featured:
Plat Showing Resubdivision of Lot 12, Riverview at Mount
Vernon, Mt. Vernon District, Fairfax County, Virginia,
November 5, 1999. Facsimile map. Alexandria, Virginia:
R.C. Fields, Jr. and Associates, 1999 (7)
Record Plat of Riverview at Mount Vernon, Mt. Vernon
District, Fairfax County, Virginia, May 1, 1995. Facsimile
map. Alexandria, Virginia: R.C. Fields, Jr. and Associates,
1995 (6)
W. Gillingham. Map of George Washington's Land at Mount
Vernon, Fairfax County, Virginia, 1850. Facsimile map.
Geography and Map Division, Library of Congress (3)
George Washington (1732-1799). A map of General Washington's
farm of Mount Vernon from a drawing transmitted by the
General, [1801]. Facsimile map. Geography and Map Division,
Library of Congress (2A)
George Washington (1732-1799). A plan of my farm on Little
Hunting Creek & Potomack River, [1766]. Facsimile
map. Geography and Map Division, Library of Congress (2)
A plan of Mr. Clifton's neck land platted at a scale
of 50 poles to the inch by TH 1755 & copied by GW,
1760. Facsimile map. Geography and Map Division, Library
of Congress (1) |
A Hydrographic Survey of New Orleans Riverwalk
In addition to surveys of boundary lines, surveyors provide
many other types of services. Among these are topographic
maps showing the slope or contours of the land, and the physical
features on the land. A specific type of topographic surveying
that shows the contours of land under water is called hydrographic
surveying. This hydrographic survey map was created to assist
an accident investigation on the Mississippi River at New
Orleans, Louisiana.
|

New
Orleans Riverwalk Ship Collision Site Survey. Float
Observations and Hydrographic Survey of December 22 & 23,
1996.
Baton Rouge, Louisiana: Hydro Consultants, Inc, 1997 (8A)
[Digital ID# ctr00017]
|
Geographic Information Systems
|

Multiple
Layers: GIS in Action-Fairfax County, VA.
Fairfax County, Virginia, Department of Information Technology,
GIS and Mapping Services (8B)
[Digital ID# ctr00018]
|
A GIS Map of Fairfax County
This Geographic Information System (GIS) map shows a variety
of "layers" within the digital file for a portion
of Fairfax County, Virginia. Such maps are used for land
planning, emergency services routing, utilities inventory,
and many other purposes. Each "layer" of data can
be viewed independently, or as a composite. The inset shows
an area in the vicinity of Washington's River Farm shown
in maps 5, 6, and 7. Because the information in a GIS is
digital, it can be transferred through the internet.
|
Cartography
|
Cartography: Thematic
A Map of the Travels of Frederick P. Beierle
The use of a map to complement newspaper articles provides
a telling and controversial story of the expansive travels
of the article's subject, Frederick P. Beierle, a nuclear
waste entrepreneur.
|

The
Travels of Fredrick P. Beierle
Entrant: Philadelphia Enquirer.
Outstanding Achievement, 1983.
American Congress on Surveying and Mapping Collection,
Geography and Map
Division (9)
[Digital ID# ctr00019]
|

Northwest
Orient Route Map
Entrant: R.R. Donnelly Cartographic Services.
Outstanding Achievement, 1984.
American Congress on Surveying and Mapping Collection,
Geography and Map
Division (10)
[Digital ID# ctr00020]
|
Cartography: Recreation and Travel
Northwest Orient Route Map
Although national and world maps have become commonplace
in in-flight magazines, this map demonstrates the early use
of map projection to depict global routes and origin/destination
points. The depiction of an elevation and vegetation surface
data modeling provides the passengers with a sense of the
terrain over which they are flying.
|
Cartography: Reference
Brazil-Venezuela Boundary Study Map
This map, which illustrates a U.S. Department of State international
boundary study, demonstrates the crucial role of cartography
in legal and foreign policy matters. Rivers are the only
physical feature shown in detail, because the boundary is
largely defined by watersheds.
|

Brazil-Venezuela
Boundary
Entrant: Bill Hezlep, Michelle Picard, and Sandra Shaw, Office
of the Geographer, U.S. Department of State.
Outstanding Achievement, 1985.
American Congress on Surveying and Mapping Collection,
Geography and Map
Division (11)
[Digital ID# ctr00021]
|
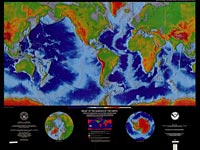
Relief
of the Surface of the Earth
Entrant: Margo Edwards, National Oceanic and Atmospheric
Administration (NOAA).
Outstanding Achievement and Best of Category, 1985.
American Congress on Surveying and Mapping Collection,
Geography and Map
Division (12)
[Digital ID# ctr00022]
|
Cartography: Thematic
Relief of the Surface of the Earth Map
Margo Edwards's relief map of the earth's surface is one
of the earliest examples of the use of the computer in generating
maps. The data was compiled using different sources. Hue
and saturation were controlled by depth and elevation; color
intensity was controlled by shaded relief.
|
Cartography: Thematic
California Population and Ethnic Distribution Map
Two thematic elements, population and ethnic distribution,
are shown side by side to create a powerful demographic portrait
of California.
|

California
Population and Ethnic Distribution
Entrant: Greg Hanzel and Keith Ryden, California State University,
Department of Geography.
Non-winning submission, 1986.
American Congress on Surveying and Mapping Collection,
Geography and Map
Division (13)
[Digital ID# ctr00023]
|

North
Cascades
Entrant: National Park Service, U.S. Department of Interior.
Non-winning submission, 1986.
American Congress on Surveying and Mapping Collection,
Geography and Map
Division (15)
[Digital ID# ctr00025]
|
Cartography: Recreation and Travel
A Map of the North Cascades
Professor Heinrich C. Berann (1915-1999) was renowned for
his ability to combine a European painting tradition with
modern cartography to produce his unique panoramic maps of
various landscapes. Born and trained in Austria, Berann honed
his technique in producing panoramas during the 1940s. His
dramatic work was sought after by a number of mapping firms,
including the U.S. National Park Service, the National Geographic
Society, and Mairs Geographischer Verlag. The North Cascades
map is an excellent example of modern cartographic techniques
used to create visual effects, such as relief.
|
Cartography: Thematic
Town of Pickering, Street Map and Facility Guide
Designed as a guide and directory, this map uses contrasting
colors to display information of use to residents and prospective
visitors to the town of Pickering, within the greater Toronto
area of Ontario, Canada. Indexes and symbols are conveniently
located adjacent to the map, and insets of detailed points
of interest are included in the design.
|

Town
of Pickering, Street Map and Facility Guide
Entrant: G. Bowlet and L. Burrett.
Outstanding Achievement, Thematic Category, 1986.
American Congress on Surveying and Mapping Collection,
Geography and Map
Division (16)
[Digital ID# ctr00026]
|
[The digital image for this object is not yet available]
Map
of the Capitol Building
Entrant: Joseph W. Wiedel, University of Maryland, Department
of Geography.
Best of Category, 1987.
Tactile map.
American Congress on Surveying and Mapping Collection,
Geography and Map
Division (17) |
Cartography: Reference
Map of the Capitol Building
This map is used by the blind and visually impaired when
touring the Capitol Building. It provides a spatial understanding
of the structure of the limited access areas available to
the public. Maps for the blind are designed to emphasize
line work and reduce the complexity of the information presented.
Tactile maps, such as this one, are created using a series
of raised dots (Braille) and embossed features, making the
map perceptible to the sense of touch and creating spatial
awareness in the user's mind.
|
Cartography: Thematic
Fire Control Dispatch Map
The map provides a visual understanding of the location
and the range of fire control assistance throughout the state
of Washington. It emphasizes the vast range of forested areas
in the state and uses industry-specific cartographic symbolization
to be used with fire control location instruments.
|

Fire
Control Dispatch Map
Entrant: Washington State Department of Natural Resources.
Non-winning submission, 1987.
American Congress on Surveying and Mapping Collection,
Geography and Map
Division (18)
[Digital ID# ctr00028]
|

New
York Helicopter Route Chart
Entrant: Interagency Air Cartographic Committee (Department
of Commerce, Dept. of Defense, Federal Aviation Administration).
U.S. Department of Commerce, National Oceanic and Atmospheric
Administration (NOAA), National Ocean Service. Non-winning
submission, 1987.
American Congress on Surveying and Mapping Collection,
Geography and Map
Division (19)
[Digital ID# ctr00029]
|
Cartography: Thematic
New York Helicopter Route Chart
This map uses technical aeronautical data to guide helicopter
flight in the densely populated metropolitan area of New
York City. It is especially effective in defining small aircraft
space amid a maze of national and international airports
servicing the region.
|
Cartography: Thematic Reference
Aerial View of the High Himalaya, Mount Everest
This map features an aerial view of Mount Everest the Himalaya
mountains, which successfully incorporates a digital terrain
model and satellite imagery containing light reflective data.
This light reflective data was then used to create a vegetation
coverage, also presented in this map. It is the result of
a joint project of the National Geographic Society and the
Henry S. Hall Jr., Everest Fund of the Museum of Science,
Boston. Swissair Photo+Survey Ltd., and the Swiss Federal
Institute of Topography performed most of the cartographic
work.
|

Aerial
View of the High Himalaya, Mount Everest
Entrant: National Geographic Society. Professional, Thematic
Outstanding Achievement, 1988.
American Congress on Surveying and Mapping Collection,
Geography and Map
Division (20)
[Digital ID# ctr00030]
|

University
of Oregon Campus at Night
Entrant: University of Oregon InfoGraphics Laboratory, Department
of Geography.
Non-winning submission, 2004.
American Congress on Surveying and Mapping Collection,
Geography and Map
Division (21)
[Digital ID# ctr00031]
|
Cartography: Thematic
University of Oregon Campus at Night Map
This map is designed to draw attention to the lighted walks
and emergency call boxes on the University of Oregon's Eugene
campus. Shades of gray and incandescent yellow simulate a
nighttime atmosphere, a departure from most campus reference
maps that primarily feature buildings. The plan to light
campus walkways achieves two goals: it creates a safer environment
for those who use the campus after dark ,and it preserves
a park-like atmosphere of the landscaped areas of campus.
|
Cartography: Recreation and Travel
Rockford Urbanized Area Transit Systems Map
Saturated color combinations and variations in line design
are used here to accentuate the bus transit system of Rockford,
Illinois. Cartographers emphasize functionality in the map's
design by including directional symbols to points of interest,
such as hospitals, health care, retirement, and extended
care facilities, perhaps targeting a demographic group that
may use the transit system.
|
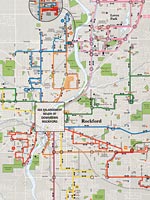
Rockford
Urbanized Area Transit Systems
Entrant: Northern Illinois University, Department of Geography,
Laboratory for Cartography and Spatial Analysis.
Non-winning submission, 1991.
American Congress on Surveying and Mapping Collection,
Geography and Map
Division (22)
[Digital ID# ctr00032]
|
Cartography: Reference Middle East/Africa School Map Maps used for primary and secondary education, like this
one by the Nystrom Maps, often use bold colors, simple line
styles, and prominent type fonts to emphasize geographic,
political, climatic, and cultural features. These cartographic
techniques eliminate clutter from the map presentation and
facilitate learning.
|
 |
 |
Middle East/Africa
Entrant: Nystrom Maps.
Middle
East - Africa
Non-winning submission, 1992.
American Congress on Surveying and Mapping Collection,
Geography and Map
Division (23)
[Digital ID# ctr00033a, ctr00033b] |
Cartography: Thematic
The Air War in the Pacific Map
The inventive use of a perspective projection and graduated
flow lines highlight this spatial and temporal picture of
the major air battles and maneuvers in the Pacific Ocean
during World War II. On one map, a sequence of events portrays
the Army Air Force's role in this military theater.
|

The
Air War in the Pacific
Entrant: Larry Bowring, Bowring Cartographic.
Non-winning submission, 1993.
American Congress on Surveying and Mapping Collection,
Geography and Map
Division (24)
[Digital ID# ctr00034]
|

Carmen
Sandiego Game Board
Entrant: Eureka Cartography.
Non-winning submission, 1993.
American Congress on Surveying and Mapping Collection,
Geography and Map
Division (25)
[Digital ID# ctr00027]
|
Cartography: Thematic
Carmen Sandiego Game Board
This popular children's geography board game combines a
colorful, geographically correct map of the United States,
with whimsical illustrations of the geographic features that "Carmen
Sandiego" and her "V.I.L.E. Henchmen" steal
in the course of the game.
|
Cartography: Thematic Reference
Map of Hurricanes of the North Atlantic, 1886-1993
History, science, and climate are presented in this map
that depicts the paths, impact, and frequency of more than
a century of major hurricanes along the eastern seaboard
of the United States. The appearance of such related data
on a single map assists long-term weather planners and emergency
organizations in predicting the paths of future hurricanes
in the region.
|

Hurricanes
of the North Atlantic, 1886-1993
Entrant: Jerome J. King IV, University of North Carolina-Charlotte.
Student Entry, Best Map Design, Student Category, 1993.
American Congress on Surveying and Mapping Collection,
Geography and Map
Division (26)
[Digital ID# ctr00035]
|

Caucasus
Region
Entrant: Leo Dillon, Office of the Geographer, U.S. Department
of State
Best of Category, 1994.
American Congress on Surveying and Mapping Collection,
Geography and Map
Division (27)
[Digital ID# ctr00036]
|
Cartography: Reference
Map of the Caucasus Region
The dissolution of the Soviet Union in 1991 created a set
of newly emerging countries and a new geopolitical map of
Eurasia. Developed by the Office of the Geographer of the
U.S. Department of State, this map shows a multicultural
and multiethnic region of the Caucasus.
|
Cartography: Thematic
National Geographic Map of Alaska
The National Geographic Society's incorporation of illustration
with relief cartography portrays the grandeur and uniqueness
of the Alaskan landscape in relation to towns, highways,
and parks. Regarded as pioneering map illustrators, the National
Geographic Society frequently adopts this techniques in maps
produced as part of its exploration studies. This Alaska
map was included as a supplement to the May 1994 issue of
the National Geographic magazine.
|
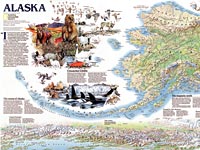
Alaska
Entrant: Robert E. Pratt, National Geographic Society.
Best of Category, 1995.
American Congress on Surveying and Mapping Collection,
Geography and Map
Division (28)
[Digital ID# ctr00037]
|

Italy
Entrant: Sally Summerall and John F. Shupe, National Geographic
Society.
Honorable Mention, 1995.
American Congress on Surveying and Mapping Collection,
Geography and Map
Division (29)
[Digital ID# ctr00038]
|
Cartography: Reference
National Geographic Map of Italy
Type fonts, elevation shading, boundary delineation, composition,
and color scheme are some of the many elements that are distinctive
to the National Geographic Society's cartographic style.
This format, common throughout the society's single map and
atlas products, presents a distinctive and readily identifiable
product of the National Geographic Society.
|
Cartography: Recreation and Travel
Relief Map of Crater Lake
Created for Crater Lake National Park, in Oregon, this map
uses terrain and bathymetry modeling to inform park visitors
of relief features of the lake. Created for the Crater Lake
National Park in Oregon, this U.S. National Park Service
map, designed by Tom Patterson, uses relief shading, landcover
information extracted from aerial photographs, and bathymetry
(depth) data to create a realistic visualization of the lake
and surrounding terrain.
|

Relief
Map of Crater Lake
Entrant: National Park Service Reference.
Outstanding Achievement, 1996.
American Congress on Surveying and Mapping Collection,
Geography and Map
Division (30)
[Digital ID# ctr00039]
|

Cultural
Map of Wisconsin
Entrant: Onno Brouwer et al., University of Wisconsin Cartographic
Lab.
Outstanding Achievement, 1996.
American Congress on Surveying and Mapping Collection,
Geography and Map
Division (31)
[Digital ID# ctr00040]
|
Cartography: Thematic
Cultural Map of Wisconsin
Designed as a companion to the state highway map of the
state of Wisconsin, this map is a cartographic and cultural
portrait of the state. The first state map of its kind, it
includes significant historical sites, areas of ethnic importance,
physical features and landscapes that have cultural importance,
and other geographic features that contributes to a local
sense of place. The project was led by David Woodward (1942-2004),
who for many years was the Arthur H. Robinson Professor of
Geography at the University of Wisconsin-Madison and editor
of the History of Cartography.
|
Cartography: Recreation and Travel
Map of Metolius River--Black Butte and Green Ridge Oregon
The skillful presentation of physical terrain coupled with
recreational information make this well-designed map a valuable
national forest guide.
|

Metolius
River--Black Butte and Green Ridge Oregon
Entrant: Imus Geographics.
Best of Category, 1996.
American Congress on Surveying and Mapping Collection,
Geography and Map
Division (32)
[Digital ID# ctr00041]
|
Cartography: Book/Atlas
Mapping Census 2000--The Geography of U.S. Diversity
This atlas presents a synthesis of the basic patterns in
U.S. population distribution in the last decade, drawing
from the U.S. Census Bureau's Summary File. Most of the maps
are choropleth maps that show numerical data by grouping
and shading it into classes, such as states and counties.
Choropleth maps are an easy way to visualize how a measurement
varies across a geographic area. The eight different color
schemes used throughout this atlas are based on color research
by Cynthia A. Brewer, Associate Professor in Geography at
the Pennsylvania State University, and are designed to optimize
the readability of choropleth maps.
|

|
 |
Mapping
Census 2000--The Geography of U.S. Diversity
Cover - Page
Entrant: Cynthia A. Brewer and Trudy A. Suchan, United States
Census Bureau.
Honorable Mention, 2001.
American Congress on Surveying and Mapping Collection,
Geography and Map
Division (33)
[Digital ID# ctr00042ab] |
Cartography: Book/Atlas
Atlas of Oregon
This atlas covers a wide array of information on the state
of Oregon, including its history, demographics, geography,
economy, politics, and wildlife. Researcher and general public
alike can derive an enormous amount of pertinent data for
understanding of the state's physical and cultural makeup
from this single-source reference.
|

Atlas
of Oregon
Entrant: William G. Loy, Stuart Allan, Aileen R. Buckley,
and James E. Meacham, University of Oregon Press.
Best of Category/Best of Show, 2001.
American Congress on Surveying and Mapping Collection,
Geography and Map
Division (34)
[Digital ID# ctr00050]
|

Countries
of the World
Entrant: Allan Cartography, Inc., and Raven Maps and Images.
Honorable Mention, 2002.
American Congress on Surveying and Mapping Collection,
Geography and Map
Division (35)
[Digital ID# ctr00043]
|
Cartography: Reference
Countries of the World Map
This map of the world uses the Robinson Projection, which
shows distortions in areas and distances that results in
a more natural visualization of the globe on a flat surface.
The projection was created by Arthur H. Robinson (1915-2004).
Robinson, under commission from Rand McNally, was a renowned
scholar of geography and cartography at the University of
Wisconsin-Madison. The National Geographic Society adopted
the projection in 1988 and was used for their world maps
for ten years. Robinson's equal-area projection has been
widely used in textbooks and atlases over the past several
decades.
|
Cartography: Thematic
Philippine Biodiversity Conservation Priorities
Intended to support conservation efforts in the Philippines,
this map captures the country's diverse tropical expanse
and its biological complexity.
|

Philippine
Biodiversity Conservation Priorities
Entrant: Mark Denil, Conservation International.
Professional Thematic, Non-winning submission, 2003.
American Congress on Surveying and Mapping Collection,
Geography and Map
Division (36)
[Digital ID# ctr00044]
|

North
American Natural Gas System
Entrant: Claude Frank, The McGraw-Hill Companies.
Honorable Mention, 2003.
American Congress on Surveying and Mapping Collection,
Geography and Map
Division (37)
[Digital ID# ctr00045]
|
Cartography: Thematic
North American Natural Gas System Map
This map of the North American natural gas system is the
most comprehensive map of this type available. With the emergence
of natural gas hubs and the increasing variety of gas transport
options available to shippers, effective analysis of the
gas industry requires a geographically comprehensive understanding
of the pipeline grid and the markets it serves. Among the
map's many features are 355,800 miles of existing and proposed
natural gas pipelines, of all diameters, labeled and colored
by ownership and sized by pipeline diameter.
|
Cartography: Recreation and Travel
Dynamap: Manhattan
This travel map of midtown and downtown Manhattan was produced
using a printing process that superimposes several images
onto one sheet with a lenticular lens--a series of small
biconvex lenses (lenticules) that refract light at different
angles. Simulating a "layering effect" characteristic
of a geographic information system (GIS), the map makes it
possible to change one's line of sight to reveal such geographic
information as the subway system, street network, and neighborhood
boundaries.
|
[The
digital image for this object is not yet available]
Dynamap:
Manhattan
Entrant: Ian White, Urban Mapping LLC.
Best of Category, 2004.
Dynamap.
American Congress on Surveying and Mapping Collection,
Geography and Map
Division (38) |

The
Great American Sports Atlas,
Sports Illustrated
Entrant: Alex Tait and James Miller, International Mapping.
Magazine
cover
Honorable Mention, 2004.
American Congress on Surveying and Mapping Collection,
Geography and Map
Division (39)
[Digital ID# ctr00046a]
This image is reproduced online with
the permission of the cartographer
|
Cartography: Thematic
The Great American Sports Atlas, Sports Illustrated
In this atlas from Sports Illustrated, geographic
analysis effectively identifies the areas of the United States
and Canada that produce great sports athletes. This type
of analysis is an inventive and informative approach to sports
statistics.
|
Cartography: Thematic
The Okanagan Wine Industry Map
This map tells the story of the Okanagan Wine Industry in
British Columbia by incorporating multivariate pictographic
symbols, information graphics, and statistics into a small
and compositional format. Historical and geographic information
is used to explain why wineries are located where they are
and how they relate to climate, soil, and geography.
|

The
Okanagan Wine Industry
Entrant: Jared Wiedmeyer, University of Wisconsin-Madison.
Student Entry,
National Geographic Society Award, printed, 2004.
American Congress on Surveying and Mapping Collection,
Geography and Map
Division (40)
[Digital ID# ctr00047]
|

Iran
Country Profile.
Central Intelligence Agency.
Geography and Map
Division (41)
[Digital ID# ctr00048]
|
Cartography: Reference
The Iran Country Profile
The Central Intelligence Agency (CIA) produces a number
of world maps and maps of particular regions that are useful
for those seeking a quick review of a place or a variety
of data on a country. These maps, such as this one of Iran,
can be freely used by the public.
|
Geodesy
Global Position System (GPS)
The Global Positioning System (GPS), originally used by
the U.S. Armed Services, has become a valuable tool for many
technological and daily-life applications. The GPS constellation
consists of 24 active satellites in 6 orbital planes located
at an attitude of 20,200 kilometers. The satellites transmit
signals to the earth's surface, where they are gathered by
receivers. The data are then processed to provide highly
accurate positioning relationships between the satellites
and the receivers. The application of GPS data is dependent
on a number of factors. Only data know as "survey grade" can
be used for precise positioning.
Geodesy
Geodesy, which involves the determination of precise locations
on the earth's surface, such as latitude and longitude, has
been in use since mariners attempted at sea to determine
their location by astronomical means. Today, with the introduction
of the Global Positioning System (GPS), geodetic concepts
help people determine their location in many ways. Shown
is a variety of everyday uses for GPS technology, including
hand-held receivers that assist hikers, and other GPS units
that facilitate traffic routing, help golfers know where
they are on the course, allow boaters and fishermen to explore
waterways without the fear of getting lost, and direct travelers
to their desired location.
|
Map of the 39th Parallel Arc
One of the first long-distance applications of geodesy in
the United States was the 1871 survey along the 39th Parallel
Arc, which lies near the north/south center of the country.
An accurate determination of the line along the North 39
degree latitude established a central reference point for
later surveys. The concept for such a system was the basis
for the Public Lands System initiated after the Louisiana
Purchase in 1803 and is still used today.
|

The
United States Territories. Map
of the 39th Parallel Arc.
Geography and Map
Division (46A)
[Digital ID# ct001500]
|
