Testing the Waters
A Guide to Water Quality at Vacation Beaches
2012 Report Findings:
Our nation's beaches continue to experience significant water pollution that hurts local economies and puts the health of beachgoers and swimmers at risk.
Learn More About Your Beach
Tweet Your Support

Share on Facebook


You can access this information from your smartphone.
Try it at: beachquality.org
State-by-State Results
How to Understand the State Summaries: Beachwater Quality Monitoring Programs
Program elements
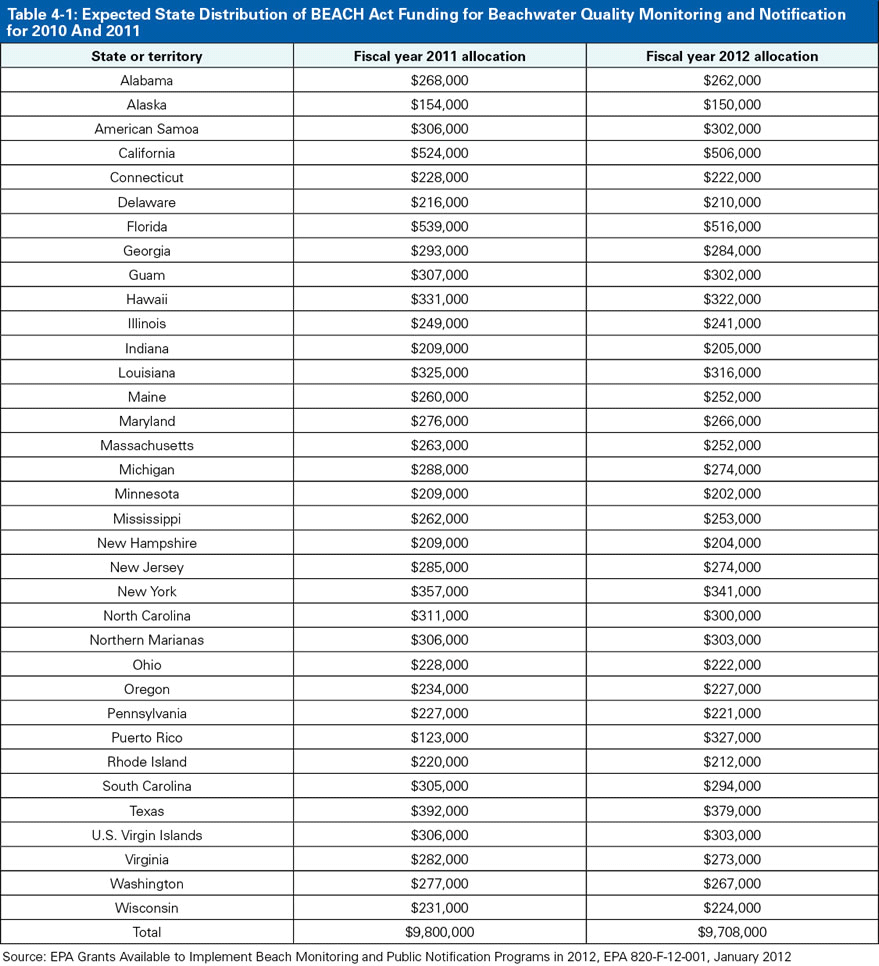
The BEACH Act authorizes the EPA to award grants to states for implementing programs to monitor coastal recreational waters adjacent to beaches used by the public for compliance with the standards for pathogen indicators. Grant funds are also used to notify the public promptly of any exceedances through posting or equivalent means. The allocations for Fiscal Years 2011 and 2012 are included in Table 4-1.
Many states and localities supplement their Beach Act funding so that they can achieve the objectives of their beachwater monitoring programs.
Water Quality standards
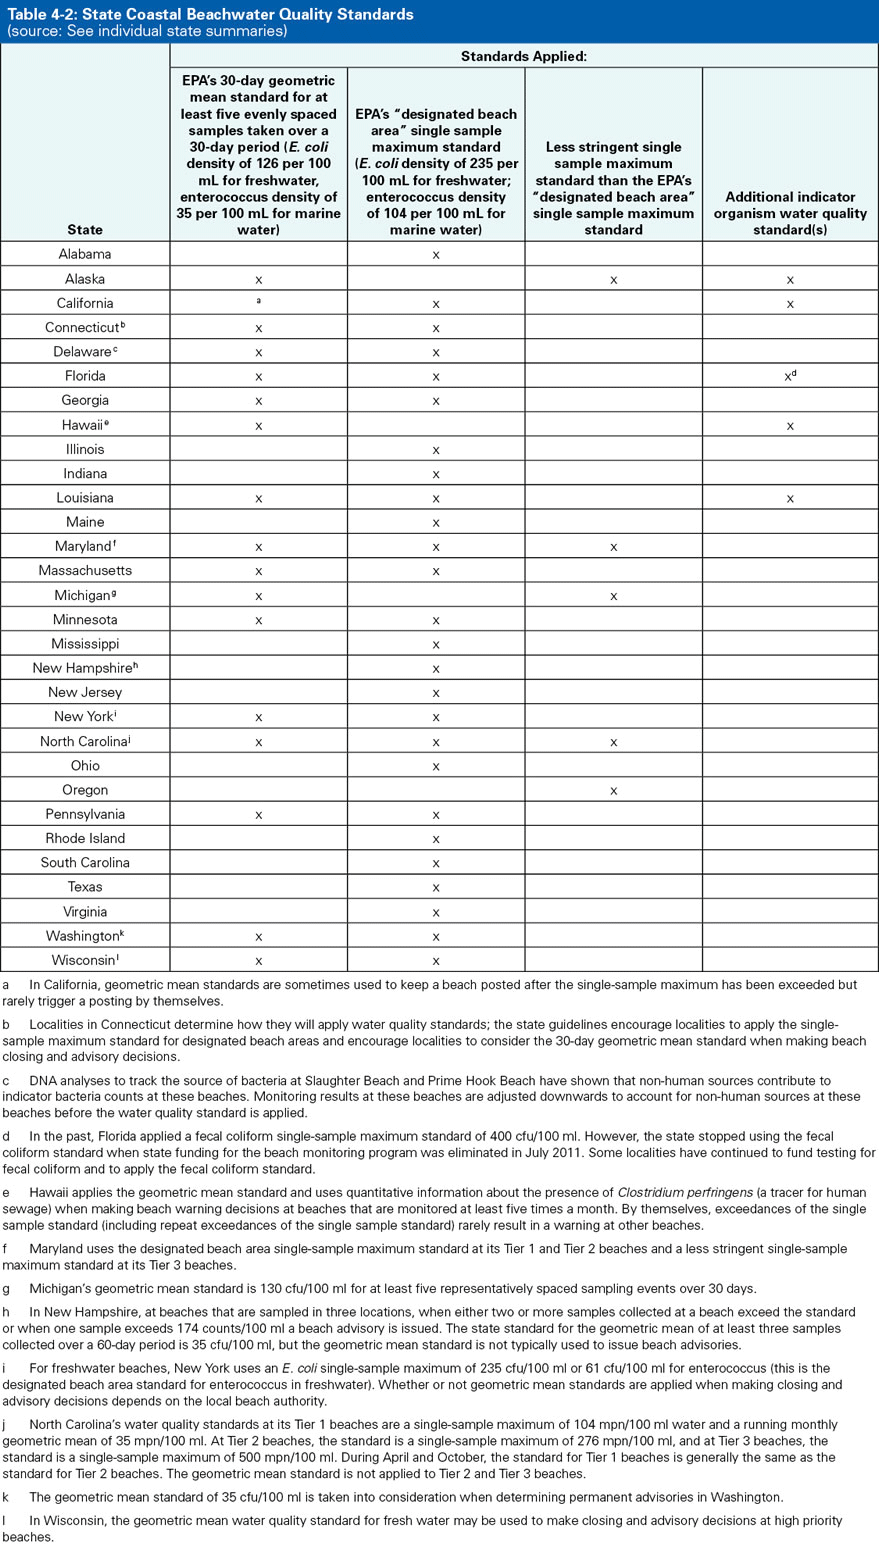
The EPA's current beachwater quality standards include a geometric mean indicator density for at least five samples taken at evenly spaced intervals over 30 days, and a single-sample maximum allowable indicator density.1 Some state and local agencies apply both the geometric mean and the single-sample standards and issue beach closings or advisories if either standard is exceeded; others apply the geometric mean standard or the single-sample standard but not both. Some states apply the single-sample maximum allowable indicator density standard for designated beach areas, some states apply less stringent standards, and some apply designated beach area standards to some of their beaches and less stringent standards to others. Also, there are states that apply additional water quality standards that are not associated with the EPA's standards when they make their closing and advisory decisions. Table 4-2 summarizes the states' use of water quality standards (more details about state standards are given in the individual state summaries elsewhere in this report).
Monitoring
There is a considerable amount of variability among state beachwater monitoring protocols. Some states perform additional monitoring after exceedances and when they expect beachwater to be contaminated. Others adhere to a schedule that doesn't vary with circumstances. Some states take multiple samples that are composited before analysis, or analyze multiple samples and average the results before applying them to the water quality standard.
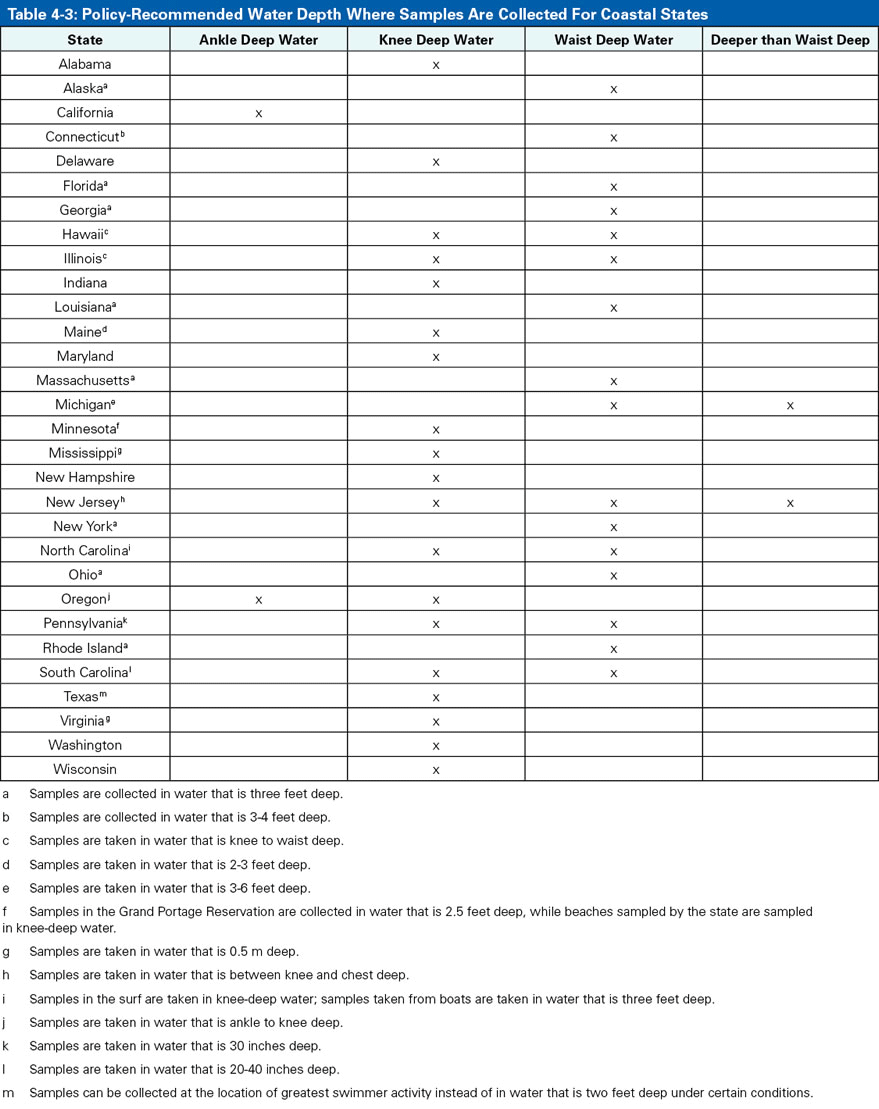
States also vary as to how often they sample. Some states monitor their high-priority beaches almost daily, while other states monitor their high-priority beaches less than once a week. Moreover, sampling techniques differ by state. The EPA recommends that samples be collected 12 inches below the surface in water that is three feet deep, but states report collecting samples at varying depths. Some states are particular about collecting samples at a particular time of day or tidal stage. Samplers in some states wade into the surf and hold the collection container in their hand to collect the sample, others use a telescoping golf ball retriever so samples are collected far from the sampler's body.
Sampling practices can have a major impact on whether or not an advisory or closing is issued. A study conducted at Hobie Beach in Florida found that samples taken at times of high solar radiation were less likely to exceed standards than samples taken when solar radiation was low.2 Solar radiation varies with the time of year, the time of day, and the clarity of the atmosphere; it is greatest at high noon near the summer solstice on a clear day. The same study found that enterococcus levels were higher in samples that were collected in knee-deep water than in samples taken in waist-deep water. Table 4-3 shows the depth of water samples are collected in by state.
Public Notification Practices
Along with different standards for triggering an advisory or closure, states vary as to whether or not they issue a public health advisory or close a beach or both when sampling has found bacteria levels that exceed the standards. Some states wait until there have been two consecutive standard violations before an advisory is issued, and some take other factors into account when an exceedance occurs before deciding to issue a closing or advisory.
Methods for notifying the public of health advisories and beach closures are variable among states as well, and for some beaches it may be difficult for beachgoers to get complete information about any notifications. States make use of a variety of notification methods, including the Internet, toll-free phone lines, signs posted at beaches, electronic notifications, newspaper notices, and television and radio coverage in conjunction with the weather report. At a minimum, public notification for beach closings and advisories should include a sign or flag at the beach and an easily located website.
How to Read the State Summaries
NRDC’s report includes the summaries of 30 state beachwater quality standards, monitoring and closing/advisory practices, and NRDC's 2010 monitoring results and closings and advisories, listed alphabetically by state. It is impossible to make direct comparisons between states or to assess trends over time on the basis of advisory and closure data. Standards, monitoring, and closing/advisory practices vary from state to state, making it difficult to know, for example, whether a state with many closings has vigilant health officials or has more coastal pollution. High numbers of closings and advisories, while indicating pollution problems, may also indicate that the state or county is making a good effort to protect the public health by vigilantly monitoring its waters, informing the public when they are polluted and taking a precautionary approach to closings and advisories. States with comprehensive programs and closure practices should be commended for their efforts.
A meaningful way of comparing beachwater quality between states or tracking it over time is to compare the percent of monitoring samples taken at each beach that exceed the national recommended single-sample maximum standards for designated beach areas. NRDC has provided these values for beaches in all 30 coastal and Great Lakes states.
Many states have dedicated and talented individuals that work hard to improve their beachwater quality and to protect public health when beachwater quality is poor. States that do more than monitor their beachwater and issue closings and advisories should be recognized for their extra efforts.
The state summaries are organized into sections as described below.
Rank in the Nation
Each state's national ranking in percent exceedances is based on the percentage of samples reported to exceed the EPA's applicable single-sample maximum for designated beach areas. For marine water, this standard is an enterococcus density of 104 per 100 ml, and for freshwater it is an E. coli density of 235 per 100 ml. EPA standards are currently in the process of being revised; these values were in place in 2011. Rankings go from 1st for the state with the lowest percent exceedances to 30th for the state with the highest percent exceedances.
Key Findings
2011 Beachwater Quality Summary: This pie chart shows a measure of water quality at the state's beaches. Beaches with 0% of samples exceeding state's daily standards make up the green slice, beaches whose samples exceeded the state's daily standards more than 0% of the time to 10% of the time make up the yellow slice, beaches whose samples exceeded the state's daily standard more than 10% of the time to 20% of the time make up the orange slice, and beaches whose samples exceeded the state's daily standard more than 20% of the time make up the red slice. Beaches that were not monitored and beaches that were monitored less than 12 times in 2011 make up the grey slice.
Reported Sources of Beachwater Contamination Statewide: The EPA asks states to report a source (usually a source of contamination) for each closing and advisory event, and the reported information is presented in this bulleted list. Sometimes the source of a closure or advisory is not contamination-related; for example, beaches can be closed for riptides or shark sightings. In 2008, some states began systematically reporting beach-specific (not closing and advisory day specific) sources of contamination at their beaches. This information is not presented in the bulleted list.
What Does Beachwater Monitoring Show?
This section describes the number of beaches monitored in the state and what their assigned monitoring frequency is. The percent of samples that exceeded state standards is given. For this section, NRDC calculated percent exceedance rates by taking the number of samples exceeding the state's daily maximum standards and dividing that number by the total number of samples collected during the calendar year. NRDC considers all reported samples individually (without averaging) when calculating the percent exceedance rates in this analysis. This includes duplicate samples and samples taken outside the official beach season, if any. These exceedance determinations are used for tracking water quality over time. The list of beaches with highest exceedances in the state excludes beaches with less than 12 monitoring samples reported during the year.
This section also shows the trends in beachwater quality from 2007 to 2011. When making year-to-year comparisons, NRDC only includes beaches that were sampled all five years. Thus, each state summary has three 2011 percent exceedance rates that might not agree: one that was calculated based on national single-sample maximum water quality standards for designated beach areas, one that was calculated based on the state's daily maximum standard, and one that was calculated based on the state's daily maximum standard for the set of beaches that appear in all five years from 2007 to 2011.
What Are the State's Sampling Practices?
In this section, the state's beach monitoring season is given along with the level of control that the state's program has over local beach monitoring and notification practices. Sampling protocols and factors the states use to determine which beaches to monitor and how frequently to monitor them are also described. This section tells if a state chooses to sample when and where the water quality is suspect, or if monitoring is conducted more frequently after a closing or advisory is issued.
High numbers of closings and advisories may indicate that the state or county is making a good effort to protect public health by vigilantly monitoring its waters and closing beaches when they are polluted.
How Many Beach Advisories Were Issued in 2011?
The total number of beach closing and advisory days for each beach is included in the monitoring results table mentioned above. In an effort to be consistent in tabulating closings and advisories, NRDC used the following guidelines:
- Closings or advisories issued for an individual beach for one day are counted as one closing/advisory day.
- If a reported advisory at a specific beach overlapped with a general rain advisory that applied to all beaches within the same jurisdiction, the overlapping days were subtracted from the advisory for that specific beach to avoid double counting. However, if a specific beach was closed during a general rain advisory, NRDC did not modify the reported duration.
- Reported closing/advisory days include only events lasting six consecutive weeks or less. Closing and advisory days for events lasting more than six weeks are reported separately as extended (more than 6 but not more than 13 consecutive weeks) or permanent events (more than 13 consecutive weeks).
- In the case of standing advisories that depend on local conditions, NRDC is typically unable to calculate the number of days attributable to such events, so they are only included to the extent that states report them to the EPA.
How Does the State Determine When to Warn Visitors About Swimming?
This section describes the state standards. Information about any use of predictive models and preemptive standards for issuing beach closings and advisories is included, as well as what factors are involved when a state decides issue a closing or advisory.
Methodology for NRDC's Report: Sources of Information
NRDC relies on the EPA's electronic reporting system for information collected under the federal BEACH Act. Information from the electronic reporting system has been supplemented by NRDC surveys of state and local officials. Beach monitoring coordinators in nearly every state cooperated with NRDC with a great deal of patience and grace and provided interesting and meaningful information for this report. NRDC is thankful for their time and their openness.
Although greatly improved, the EPA's electronic data submission system continues to experience some technical problems, resulting in potential delays in data availability and incomplete data. Therefore, NRDC requested 2011 beach season monitoring and closing/ advisory data directly from the states. When states provided these data, NRDC used them; otherwise, we used monitoring data downloaded from the EPA's STORET website and closing/advisory data sent to us by the EPA.
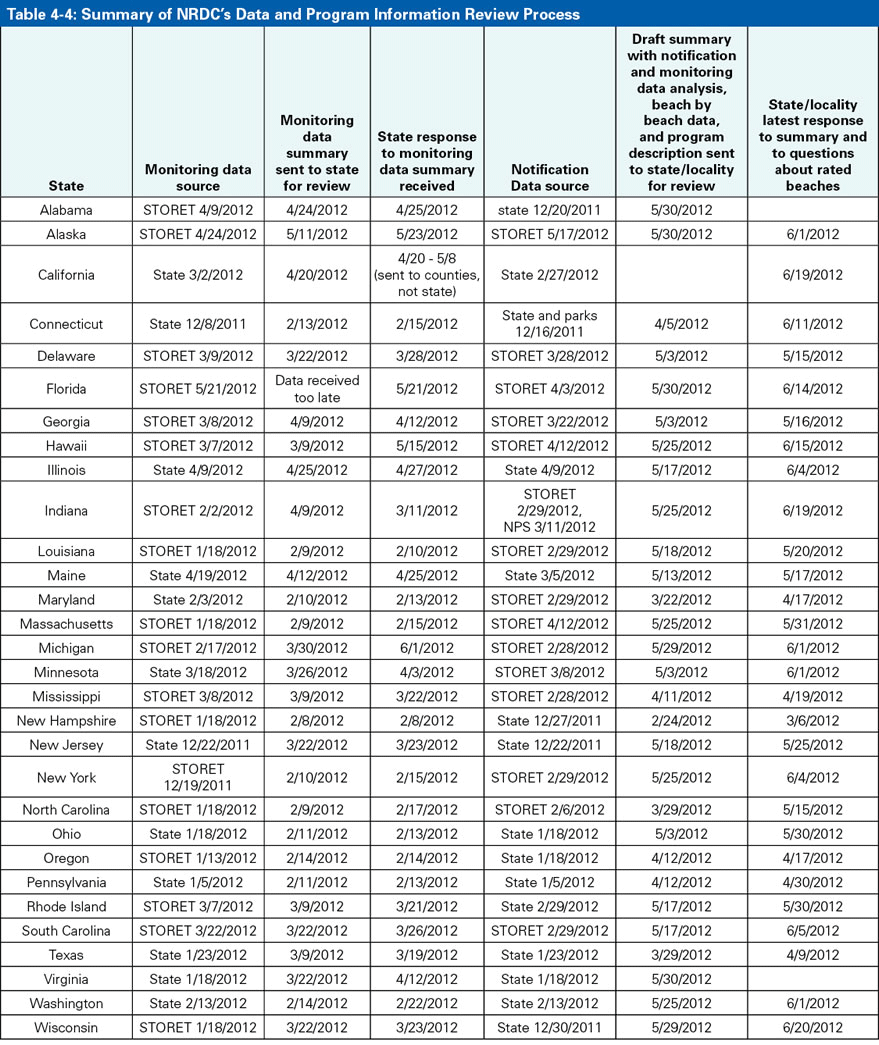
NRDC first began contacting states in December, 2011, asking them when and if their annual report would be available and if they could provide NRDC with their monitoring and/or notification data directly. Between January and April, every state was sent a survey about their program and their beach management practices. Between February and mid-May, every state but Florida (whose data arrived too late) was sent a summary of monitoring data for their verification. By the end of May, except for California, who worked closely with NRDC over a long period of time to resolve questions about data, NRDC sent each state a draft of their summary for review, verification, and comment. This draft contained NRDC's analysis of the notification and monitoring data as well as the narrative material for each state. Followup questions about state practices and additional data corrections were made into June, when states and localities were contacted with very specific questions about beaches on the ratings chart.
A summary of contacts made with states to verify program information and monitoring and notification data is given in the table below. These dates do not include original contacts with states, state responses to program surveys, or contacts regarding NRDC's questions outside of the state summary and data review process. Note that in some cases it was difficult to determine which column to put the date for a state response, for example when a state responded to an e-mail about the monitoring data with program information or notification data corrections. In several cases, NRDC stated in their communications with states that if they did not receive responses, NRDC would assume that they were in agreement with the item under review.
Many beach managers demonstrated a great deal of patience and care in providing responses to NRDC and we thank them for making the report as complete and accurate as possible.
Notes
- United States Environmental Protection Agency. Ambient Water Quality Criteria for Bacteria–1986. EPA440/5-84-002. January 1986.
- Vogel, LJ, AA Enns, AM Abdelzaher, HM Solo-Gabriele. Spatial and Temporal Variation in Indicator Microbe Sampling and its Effects on Beach Management Decisions. Poster at Beach Conference. Miami, FL. March 2011.