
During the Civil War, cartographers invented new techniques to map the country and the conflict more accurately than ever before in the nation’s history. Since then, cartographic technology has evolved in ways never imagined, but many basic elements of mapmaking remain the same. The following is an article, written by Jacqueline V. Nolan and Edward J. Redmond of the Library’s Geography and Map Division, that is featured in the November-December 2012 issue of the Library’s new magazine, LCM, and highlights progress in cartography since the Civil War.

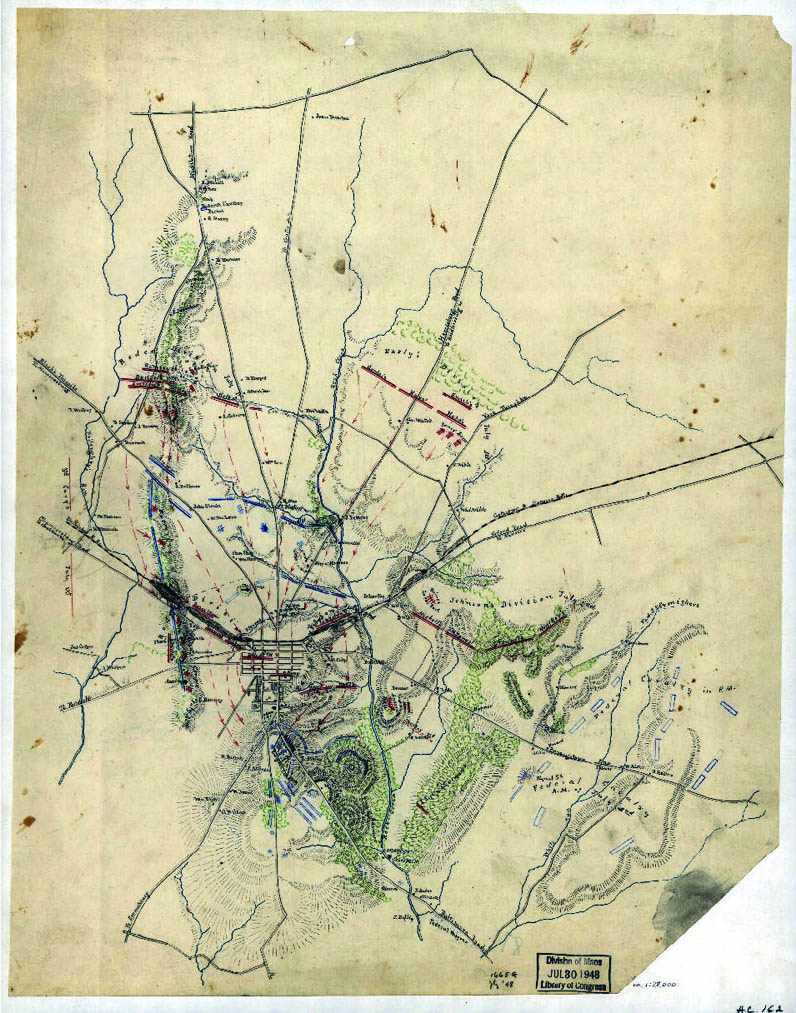
A sketch map of the battlefield of Gettysburg, 1863, by Jedidiah Hotchkiss combined with U.S. Geological Survey’s satellite-derived map with attributes from the National Hydrography dataset
Mapmaking has been revolutionized since the Civil War. Comparatively speaking, creating a map using modern technologies little resembles yesteryear’s methodology. Yet, many consistencies in mapping prevail from one era to the next. The basic elements of map production still consist of determining geographic coordinates and reference points, construction of projections, design, compilation, drafting and reproduction.
During the Civil War era, the production of a finished map was a protracted and labor-intensive process that involved a variety of skills and crafts. It began with a land survey or field reconnaissance by a military topographer—often on horseback—with sketchbook in hand. Rivers, roads and significant landscape features were rapidly drawn in pencil on pages marked with grid lines. Direction was determined by compass bearings, and distance was tracked by pacing on foot or horseback. Data from these field sketches were later transferred to larger sheets notated with geographic coordinates to produce a composite manuscript map of an area or region at a particular scale.
If a map was to be reproduced for wider dissemination, copies could be furnished in a variety of formats. Various photographic methods were devised during the war to reproduce manuscript field surveys quickly, in limited numbers for field commanders. Woodcut engraving was favored by newspapers, which published maps almost daily to help war families locate the remote places described in the letters they received from their loved ones at the front. Official and commercial maps were engraved or lithographed, and then hand-colored. Each of these processes required trained craftsmen as well as specialized tools and equipment. The copperplate engravers who worked for the U.S. Coast and Geodetic Survey, for example, were primarily German craftsmen recruited especially for the detailed engraving required by that agency.
Current trends in mapping allow for multiple layers of data to be combined by one cartographer using Geographic Information Systems (GIS) software on a desktop computer. GIS has become a useful tool for research using spatial data analysis and is being applied to many fields of study, wherever geography can be modeled.

U.S. Geological Survey’s satellite- derived map of Gettysburg, 2007
U.S. Geological Survey’s satellite- derived map of Gettysburg, 2007
Creating a map using GIS is also a layered process. Using multiple sources of data, such as field data, research statistics, real-time data, and so on, information can be overlaid on a base map representing a geographic area of interest such as a Civil War battle site. Base layers may be characterized as either a pixilated, raster format, derived from remote-sensing imagery, or as a vector file, which depicts geography as points, lines and polygons.
Map specifications such as projection, scale, and key details are determined in this initial phase. Data is standardized to ensure attribute- matching with the base layer prior to performing data analysis.
GIS software packages include toolkits containing many devices for analysis and editing. Metadata is compiled to document specific information about the GIS project, such as source data, attribute definitions, or algorithms used for statistical computations. Analysis is the primary end-product of a GIS project, though a cartographic rendering may be created such as a paper map, a web-based application for visual interpretation on a computer screen, or applications software for display on mobile devices (apps).
MORE INFORMATION
“Re-imagining the U.S. Civil War: Reconnaissance, Surveying and Cartography” (webcast: Part I, Part II)
Hotchkiss Map Collection
Download the November-December 2012 issue of the LCM in its entirety here. You can also view the archives of the Library’s former publication from 1993 to 2011.