Civil War Cartography, Then and Now

During the Civil War, cartographers invented new techniques to map the country and the conflict more accurately than ever before in the nation’s history. Since then, cartographic technology has evolved in ways never imagined, but many basic elements of mapmaking remain the same. The following is an article, written by Jacqueline V. Nolan and Edward J. Redmond of the Library’s Geography and Map Division, that is featured in the November-December 2012 issue of the Library’s new magazine, LCM, and highlights progress in cartography since the Civil War.

A sketch map of the battlefield of Gettysburg, 1863, by Jedidiah Hotchkiss combined with U.S. Geological Survey’s satellite-derived map with attributes from the National Hydrography dataset

Mapmaking has been revolutionized since the Civil War. Comparatively speaking, creating a map using modern technologies little resembles yesteryear’s methodology. Yet, many consistencies in mapping prevail from one era to the next. The basic elements of map production still consist of determining geographic coordinates and reference points, construction of projections, design, compilation, drafting and reproduction.

During the Civil War era, the production of a finished map was a protracted and labor-intensive process that involved a variety of skills and crafts. It began with a land survey or field reconnaissance by a military topographer—often on horseback—with sketchbook in hand. Rivers, roads and significant landscape features were rapidly drawn in pencil on pages marked with grid lines. Direction was determined by compass bearings, and distance was tracked by pacing on foot or horseback. Data from these field sketches were later transferred to larger sheets notated with geographic coordinates to produce a composite manuscript map of an area or region at a particular scale.

If a map was to be reproduced for wider dissemination, copies could be furnished in a variety of formats. Various photographic methods were devised during the war to reproduce manuscript field surveys quickly, in limited numbers for field commanders. Woodcut engraving was favored by newspapers, which published maps almost daily to help war families locate the remote places described in the letters they received from their loved ones at the front. Official and commercial maps were engraved or lithographed, and then hand-colored. Each of these processes required trained craftsmen as well as specialized tools and equipment. The copperplate engravers who worked for the U.S. Coast and Geodetic Survey, for example, were primarily German craftsmen recruited especially for the detailed engraving required by that agency.

Current trends in mapping allow for multiple layers of data to be combined by one cartographer using Geographic Information Systems (GIS) software on a desktop computer. GIS has become a useful tool for research using spatial data analysis and is being applied to many fields of study, wherever geography can be modeled.

U.S. Geological Survey’s satellite- derived map of Gettysburg, 2007

U.S. Geological Survey’s satellite- derived map of Gettysburg, 2007

Creating a map using GIS is also a layered process. Using multiple sources of data, such as field data, research statistics, real-time data, and so on, information can be overlaid on a base map representing a geographic area of interest such as a Civil War battle site. Base layers may be characterized as either a pixilated, raster format, derived from remote-sensing imagery, or as a vector file, which depicts geography as points, lines and polygons.

Map specifications such as projection, scale, and key details are determined in this initial phase. Data is standardized to ensure attribute- matching with the base layer prior to performing data analysis.

GIS software packages include toolkits containing many devices for analysis and editing. Metadata is compiled to document specific information about the GIS project, such as source data, attribute definitions, or algorithms used for statistical computations. Analysis is the primary end-product of a GIS project, though a cartographic rendering may be created such as a paper map, a web-based application for visual interpretation on a computer screen, or applications software for display on mobile devices (apps).

MORE INFORMATION
“Re-imagining the U.S. Civil War: Reconnaissance, Surveying and Cartography” (webcast: Part I, Part II)
Hotchkiss Map Collection

Download the November-December 2012 issue of the LCM in its entirety here. You can also view the archives of the Library’s former publication from 1993 to 2011.

Countdown to Book-Stravaganza

Just days stand between the book-lovers of the USA and the Library of Congress National Book Festival! But don’t just stare at the countdown clock on the Festival website … check out the speaking and book-signing schedules for our 125 authors, or listen to the podcasts already available from some of this year’s authors.  That …

Read more »

Let the Games Begin!

Tonight the 2012 Olympics in London kick off. The excitement has certainly been building all year as enthusiasts have followed the torch relay and participating athletes and teams. I can admit that the games probably appeal to me for a few other different reasons than purely anticipating all the awesome competition. First, my favorite band, …

Read more »

Legal Cleanup on Aisle 4!

If someone set a bowl of cheese curls in front of you and declared it “breakfast,” would you be able to discern it from cereal? Even if you’re the type who likes cold pizza at 7 a.m., odds are you would not be too quick to pour on the milk and dive in with a …

Read more »

The View From 30,000 … Maps!

This is a guest post by Donna Urschel of the Library’s Public Affairs Office. If you’ve ever wondered where you are, or where you might be going, know this: if you have access to a computer, the Library of Congress now has 30,000 maps online to guide you. In the basement level of the Library’s …

Read more »

Gateway to Knowledge Guest Post #7

This is the seventh in a series of guest posts by Abigail Van Gelder, who with her husband, Josh, is journeying across the country on the Library’s “Gateway to Knowledge” traveling exhibition: We knew that Oberlin, OH was going to be a special event.  Oberlin College is the alma mater of Emily Rapoport—who, with her …

Read more »

Gateway to Knowledge Guest Post #5.1

This is one of a series of guest posts by Abigail Van Gelder, who with her husband, Josh, is journeying across the country on the Library’s “Gateway to Knowledge” traveling exhibition: Congressman Charlie Wilson from Ohio stopped by to welcome guests to the Gateway To Knowledge exhibit on its first day in Marietta; he was joined …

Read more »

New Optical Lab Brings LOC into 21st Century

(The following is a guest article about new preservation capabilities at the LOC by my colleague Donna Urschel, which was recently published in the the Library’s staff newsletter, the Gazette.)

Library of Congress Optical Properties Lab

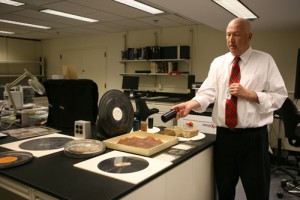
Preservation Research Chief Eric Hansen explains how equipment is used to capture sound from damaged audio recordings. (Abby Brack photo)

For many decades, details of the 1791 Pierre L’Enfant Plan of Washington, D.C.—one of the many treasures at the Library of Congress—had been obscured. A long-ago application of a varnish preservative had darkened the map’s surface. But today, thanks to special imaging techniques, the invisible streets and special locations, including the “President’s House” and “Congress’ House,” pop out.

Hyperspectral imaging, a process of taking digital photos of an object using distinct portions of the light spectrum, is revealing what previously could not be seen by the human eye.

In room 27 on the sub-basement level of the James Madison Building, fascinating details of our historical heritage are coming to light in the recently opened Optical Properties Laboratory. Operated by the Library’s Preservation Research and Testing Division (PRTD) in the Preservation Directorate, the lab contains a hyperspectral imaging system, an environmental scanning electron microscope (ESEM), equipment for optical disc quality testing and a Fourier Transform Infrared Spectroscopy (FTIR) system.

The new lab enhances the Library’s capability to use nondestructive analytical techniques to track changes in optical properties of materials, helping conservators, curators and librarians extend the life of the collections. Along the way, many interesting details about the documents are revealed.

The Optical Properties Lab is one of three new labs in the Preservation Directorate. Two more will open in the Madison Building in 2010: the Chemical and Physical Properties laboratories. The new equipment and redesigned space will bring the 30-year-old science labs of the Preservation Directorate into the 21st century.

20091203_lab_002

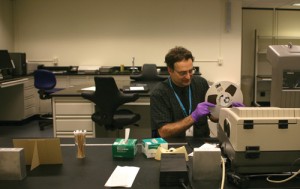
Stephen Hobaica in the Library’s Preservation, Research and Testing lab tests for chemical markers of degradation of magnetic media. (Abby Brack photo)

Read more »