


A Report on Consumer Wireline Broadband
Performance in the U.S.
FCC’s Office of Engineering and Technology and
Consumer and Governmental Affairs Bureau
Table of Contents
- Background and Overview
- Major Findings of the Study
- Description of Tests Included in Report
- Test Results

- Year by Year Comparison
- Actual Versus Advertised Speeds
- Data Consumption
- Panelist Migration
- Conclusion and Next Steps
- Acknowledgements
Background and Overview
This July 2012 Measuring Broadband America Report contains the most recent results from the Federal Communication Commission’s Measuring Broadband America program, an ongoing, rigorous, nationwide performance study of residential broadband performance in the United States. The study involves actual performance tests for thousands of subscribers of Internet Service Providers (ISPs) serving well over 80 percent of the residential market. Our initial Measuring Broadband America Report, released in August 2011, presented the first broad-scale study of actual home broadband performance throughout the United States. The Measuring Broadband America program developed out of a recommendation by the National Broadband Plan (NBP) to improve the availability of information for consumers about their broadband service.1 It is part of a comprehensive series of initiatives that draw upon cooperation between the Commission, industry, and other stakeholders to promote transparency and ensure that consumers get the information they need to make informed marketplace decisions and to effectively manage communications subscriptions and services. Other examples include the “bill shock” initiative, which notifies mobile subscribers before they incur overage charges, and the PROTECT initiative, which informs consumers about how to secure their smartphones and deters theft by preventing smartphones from being reactivated.
Improvements across key metrics
This Report provides an update on the data collected in March 2011 and released in our August 2011 Report.2 That Report (available with accompanying data sets at fcc.us/mba0811report) found that for most participating broadband providers, actual download and upload speeds were over 80 percent of advertised speeds.3 This Report updates the information contained in that Report and provides additional data, charts, and analysis. Though the testing that informs the data in this Report was conducted in April 2012, only about a year after the testing for the August 2011 Report, it reveals striking across-the-board-improvements on key metrics underlying user performance. There is evidence that our August 2011 Report helped prompt these changes, and had a substantial impact on both the industry and on consumer broadband experience.4
We have identified three primary improvements in residential broadband service.
1. ISP promises of performance are more accurate.
First, accurate delivery of advertised performance by ISPs has improved overall. Five ISPs now routinely deliver nearly one hundred percent or greater of the speed advertised to the consumer even during time periods when bandwidth demand is at its peak. In the August 2011 Report, only two ISPs met this level of performance. In 2011, the average ISP delivered 87 percent of advertised download speed during peak usage periods; in 2012, that jumped to 96 percent. In other words, consumers today are experiencing performance more closely aligned with what is advertised than they experienced one year ago.
Our analysis shows that the improvements of ISPs in meeting their advertised speeds were largely driven by improvements in network performance, and not downward adjustments to the speed tiers offered. As set forth in more detail below, there was a significant increase in the April 2012 data in the actual average speed delivered by participating ISPs to their customers.
2. ISPs are more consistent in their ability to deliver advertised speeds.
Second, differences among ISPs in their ability to deliver advertised speeds are now smaller. Last year’s results showed what at times were wide variances between top performers and bottom performers in meeting advertised speeds. For comparison’s sake, we computed the standard deviation (or spread) in meeting advertised speeds during peak usage periods across all ISPs for the testing periods used in our August 2011 Report and in this Report. A smaller spread indicates more uniformity in performance across ISPs. The standard deviation for download speed across all technologies dropped from 14.4 percent, as computed from the August 2011 Report, to 12.2 percent in this Report. This 15 percent reduction is an indication that ISPs are delivering significantly more uniform performance than they were a year ago.
We believe that the August 2011 Report was a significant factor in improvements in ISP delivery of advertised speeds. Since the release of that Report, the Commission has continued to engage in discussions with the participating ISPs, and these providers have told us that last year’s study provided valuable insight into the effectiveness of their practices. The results of the tests reported in August 2011 comparing advertised to actual broadband speeds informed the marketplace, showing up in the news, on the websites of consumer groups, and in the television commercials, radio ads, and press releases from ISPs themselves. Over the past year, we have seen significant investments by ISPs in their networks, and the gap between advertised and actual speeds narrowed. Some ISPs that had the largest gap last year have improved remarkably in a flight to quality. Cablevision, which last year delivered only about 50 percent during the most demanding peak usage periods, in 2012 delivered better than advertised speeds across each of its speed tiers during peak periods. Almost across the board, the July 2012 Report shows that ISPs are doing a better job of delivering what they promise to their customers today than they did a year ago.
3. Consumers are subscribing to faster speed tiers and receiving faster speeds.
Third, we found that, on average, customers subscribed to faster speed tiers in 2012 than in 2011. This is a result of both upgrades by ISPs to their network as well as some migration of consumers to higher speed services. To illustrate this shift, we computed the average speed offered by ISPs across all panelists in 2011 and 2012. Due to the manner in which panelists are chosen,5 this provides a rough correlation with average subscribed tiers within the United States for the participating ISPs during the testing period. During the testing period for the August 2011 Report, the average speed tier was 11.1 Megabits per second (Mbps);6 for this Report, it increased to 14.3 Mbps, an almost 30 percent increase in just one year. Because ISPs also did a better job in the testing period for this report of meeting or exceeding their advertised speeds, the actual increase in experienced speed by consumers was even greater than the increase in advertised speed—from 10.6 Mbps to 14.6 Mbps—an almost 38% improvement over the one year period.
Even though our study necessarily focuses on the most popular service tiers within a company and not on the maximum speeds that may be offered by ISPs, we are encouraged to see that higher and higher speed tiers are becoming available to consumers. Last year, the fastest service tier that was popular enough to be included in our testing was 35 Mbps. In this year’s report, two ISPs had tiers in excess of 35 Mbps that were sufficiently popular to be included in the survey, and many ISPs have begun to introduce tiers of 100 Mbps and higher for consumer use. Although not all of these new ultra-high speed tiers have sufficient subscription rates to be included in the July 2012 Report, at least seven of the ISPs participating in this study advertise tiers of 50 Mbps, and four of those ISPs also offer tiers of 100 Mbps or higher in at least some of their service areas.
Expectation that improvements will continue
The increase in the availability and adoption of faster speed tiers is a positive indicator that the U.S. market is moving toward the goal, set out in the NBP, that at least 100 million homes should have affordable access to actual download speeds of at least 50 Mbps by 2015, and 100 Mbps by 2020.7 As noted in the NBP, such expansion in high speed networks across the nation will provide economic opportunities, increase civic engagement, deliver on the promise of better access to healthcare and online learning, and help fuel the development of a smart power grid and a more highly interactive and responsive public safety network. Infrastructure empowers innovation and innovation drives demand for infrastructure. Broader access to fast broadband will encourage the expansion and adoption of cloud computing, more productive telecommuting, online education, telemedicine, and more.
We know that the investments required in making these improvements, in terms of personnel, planning, and capital, are not trivial, and we applaud the ISPs in this study for improving the quality of broadband access for the public. The Report does highlight that some ISPs can still stand to improve and we hope and expect that the data disclosed herein will continue to drive such improvements.
Many of the ISPs participating in this study have discussed their plans for continued investment in improving network performance and the ability of their architectures to support ever higher speeds. Whether these higher performance levels are broadly accepted by consumers will undoubtedly depend upon the pricing levels at which they are offered as well as the ability of innovators to leverage this capability into new applications and services. Adoption, and innovation by application and service providers, will also likely depend upon other service factors as well, particularly data caps and usage-based pricing. We can only note at this point that over the past decade, maximum Internet access speeds available to consumers have risen from only a few Mbps to recently advertised access speeds of 300 Mbps. We expect for the foreseeable future that the rising tide of improved network performance will raise performance levels for all consumers, and that an innovative industry will capitalize on this by developing new services and capabilities that will benefit all.
We also understand the challenges faced by ISPs in attempting to upgrade to higher speeds. End to end performance may depend upon customer provided modems terminating Internet service and this can become an obstacle in planned service evolutions by ISPs. For example, “legacy” equipment may impede some panelists from receiving the subscribed speed from their ISP, and the presence of this equipment at a panelist’s location can prevent the ISP from controlling the broadband performance to the panelist’s home.8
We hope through a combination of the availability of high speed Internet services, compelling applications utilizing these services, and increased consumer awareness, that consumers will make the changes required to effectively use these high speed services, enabling them to enjoy the full benefits that they offer.
New with this Report, we have also included information on the correlation between speed tier and data consumption. Overall, that information shows that faster speeds result in more data consumption. Though this result is not surprising, it is important support for our view that as consumers receive higher performance levels, they take advantage of this capability by using applications and services that demand the download and upload of more data.
Background on production of the Report
At the outset of the Measuring Broadband America study, the Commission launched an open competition for entities that could assist with the design and management of a study of broadband performance. The FCC ultimately selected SamKnows, an analytics company that had recently completed a similar study of broadband performance for Ofcom, the United Kingdom’s telecommunications regulatory agency, to administer its broadband testing initiative. SamKnows continues to administer this program for the Commission.
As with the August 2011 Report, this Report uses measurement hardware and software deployed in the homes of thousands of volunteer consumers to conduct automated, direct measurements of broadband performance.9 All testing represented in this Report was conducted in April 2012; testing for the August 2011 Report was conducted in March 2011. The Report focuses on three ISP delivery technologies—DSL, cable, and fiber.10 These three technologies continue to provide Internet service to the vast majority of homes in the United States.11 The study examines service offerings from 13 of the largest broadband providers,12 which collectively account for well over 80 percent of all U.S. wireline broadband onnections. This Report focuses on the major findings of this study, while a separate Technical Appendix provides a detailed description of the process by which the measurements were made and describes each test that was performed. The structure of this Report and the measurements represented herein largely track the August 2011 Report, which we hope will provide a useful baseline for comparison. We have added new metrics to this Report, including cumulative distribution charts showing the percentage of consumers receiving a given percentage of advertised speed or better from a service provider, and a chart showing how speed tier subscription affects consumption patterns. We have also modified the formats of key charts to improve legibility.
As with the August 2011 Report, many of the charts and metrics emphasize the peak usage period of weeknights between 7:00 pm to 11:00 pm local time as opposed to a 24-hour reporting period. We continue to believe that focusing on the peak usage period provides the most useful information for consumers because it demonstrates the kind of performance consumers can expect when the largest number of people are accessing the Internet and delivery of Internet service is under the most strain. While we measure other time periods and include the results of these off-peak tests in data sets that will be released to the public, we use peak usage period performance for the purpose of comparing ISPs.
Throughout this Report we use the term “advertised speed” to refer to the speed ISPs use to advertise and market a particular broadband service, e.g., “1.5 Mbps DSL” versus “7 Mbps DSL.” We also use the term “sustained speed.” On a short time scale, broadband speeds or information rates may vary widely, at times approaching or even exceeding advertised speeds and at other times—due to network congestion—slowing to rates that may be well below advertised speeds. To provide an estimate of long-term average broadband performance, in this Report we indicate “sustained speed,” which is speed averaged over a period of several seconds.13
It is important to note some limitations on the results contained in this Report. Only the most popular service tiers among an ISP’s offerings were tested, even though some service providers may offer other untested tiers.14 In addition, the data are only analyzed at the national level, and we do not collect it in a way that permits meaningful conclusions about broadband performance at the local level.15 Also, the results only include measurement of the data path from the content source to the consumer, and any bandwidth limitations or delays incurred in the consumer’s home or in segments of the Internet outside an ISP’s network are not reflected in the results.
For practical reasons, certain consumer broadband technologies are not analyzed in this Report. Mobile broadband services, which are increasingly important to consumers, were not included in this study due to the special challenges inherent in measuring the actual performance of mobile networks. We are working to address those challenges and believe accurate and detailed disclosures of performance of mobile broadband networks are essential to consumers. Due to the small number of consumer volunteers for satellite and fixed wireless services in the current study, limited data were collected on these technologies, and consequently these results are not included in this Report. However, the raw data captured for both of these technologies will be made available to the public, and we are working to include these technologies in greater detail in the future.
The basic objective of the Measuring Broadband America study is to measure broadband service performance as delivered by an ISP to the home of a consumer. Although many factors contribute to end-to-end consumer broadband performance, this Report focuses on those elements of the Internet pathway under the direct or indirect control of a consumer’s ISP on that ISP’s own network: from the consumer gateway—the modem used by the consumer to access the Internet—to a nearby major Internet gateway point. This focus aligns with key attributes of broadband service that are advertised to consumers and allows a direct comparison across broadband providers of actual performance delivered to the household.
This Report, like the August 2011 Report that preceded it, could not have been produced without the benefit of the ongoing discussions held with a broad array of individuals and entities that include the participating ISPs, equipment manufacturers, M-Lab,16 and academics. We are also encouraged that many broadband providers have found this ongoing measurement study sufficiently valuable to adopt our methodology to develop their own internal broadband performance testing programs. ISPs have also used the results of this study to improve their ongoing disclosures to consumers.
While this Report already provides information relevant to the vast majority of residential broadband subscribers in the U.S., we have plans to significantly expand the Measuring Broadband America program. We will be releasing a second Measuring Broadband America Report later this year that will continue to closely chart the evolution of residential broadband performance and offerings. That Report will be part of our ongoing efforts to develop data and analysis on broadband performance relevant to consumers. As noted above, we also plan to test and deliver information about additional broadband delivery technologies, including mobile broadband, to more comprehensively detail the consumer broadband experience.
Major Findings of the Study
- Actual versus advertised speeds. The August 2011 Report showed that the ISPs included in the Report were, on average, delivering 87 percent of advertised speeds during the peak consumer usage hours of weekdays from 7:00 pm to 11:00 pm local time. The July 2012 Report finds that ISP performance has improved overall, with ISPs delivering on average 96 percent of advertised speeds during peak intervals, and with five ISPs routinely meeting or exceeding advertised rates.
- Sustained download speeds as a percentage of advertised speeds. The average17 actual sustained download speed during the peak period was calculated as a percentage of the ISP’s advertised speed. This calculation was done for each speed tier offered by each ISP.
- Results by technology:
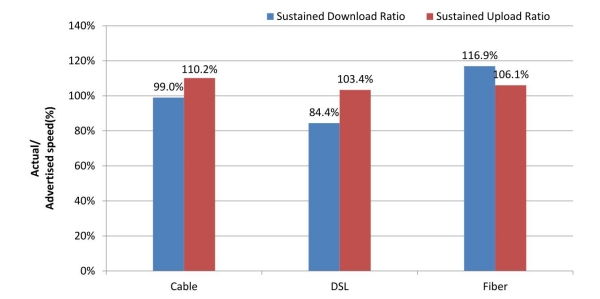
- On average, during peak periods DSL-based services delivered download speeds that were 84 percent of advertised speeds, cable-based services delivered 99 percent of advertised speeds, and fiber-to-the-home services delivered 117 percent of advertised speeds.18 This compared with 2011 results showing performance levels of 82 percent for DSL, 93 percent for cable, and 114 percent for fiber. All technologies improved in 2012.
- Peak period speeds decreased from 24-hour average speeds19 by 0.8 percent for fiber-to-the-home services, 3.4 percent for DSL-based services and 4.1 percent for cable-based services. This compared with 0.4 percent for fiber services, 5.5 percent for DSL services and 7.3 percent for cable services in 2011.
- Results by ISP:
- Average peak period download speeds varied from a high of 120 percent of advertised speed to a low of 77 percent of advertised speed. This is a dramatic improvement from last year where these numbers ranged from a high of 114 percent to a low of 54 percent.
- In 2011, on average, ISPs had a 6 percent decrease in delivered versus advertised download speed between their 24 hour average and their peak period average. In 2012, average performance improved, and there was only a 3 percent decrease in performance between 24 hour and peak averages.
- Results by technology:
- Sustained upload speeds as a percentage of advertised speeds. With the exception of one provider, upload speeds during peak periods were 95 percent or better of advertised speeds. On average, across all ISPs, upload speed was 107 percent of advertised speed. While this represents improvement over the 103 percent measured for 2011, upload speeds have not been a limiting factor in performance and most ISPs last year met or exceeded their advertised upload speeds. Upload speeds showed little evidence of congestion with little variance between 24 hour averages and peak period averages.
- Results by technology: On average, fiber-to-the-home services delivered 106 percent, DSL-based services delivered 103 percent, and cable-based services delivered 110 percent of advertised upload speeds. These compare with figures from 2011 of 112 percent for fiber, 95 percent for DSL, and 108 percent for cable.
- Results by ISP: Average upload speeds among ISPs ranged from a low of 91 percent of advertised speed to a high of 122 percent of advertised speed. In 2011, this range was from a low of 85 percent to a high of 125 percent.
- Latency. Latency is the time it takes for a packet of data to travel from one designated point to another in a network, commonly expressed in terms of milliseconds (ms). Latency can be a major controlling factor in overall performance of Internet services. In our tests, latency is defined as the round-trip time from the consumer’s home to the closest20 server used for speed measurement within the provider’s network. We were not surprised to find latency largely unchanged from last year, as it primarily
depends upon factors intrinsic to a specific architecture and is largely outside the scope of improvement if networks are appropriately engineered. In 2012, across all technologies, latency averaged 31 milliseconds (ms), as opposed to 33 ms measured in 2011.
- During peak periods, latency increased across all technologies by 6.5 percent, which represents a modest drop in performance. In 2011 this figure was 8.7 percent.
- Results by technology:
- Latency was lowest in fiber-to-the-home services, and this finding was true across all fiber-to-the-home speed tiers.
- Fiber-to-the-home services provided 18 ms round-trip latency on average, while cable-based services averaged 26 ms, and DSL-based services averaged 43 ms. This compares to 2011 figures of 17 ms for fiber, 28 ms for cable and 44 ms for DSL.
- Results by ISP: The highest average round-trip latency for an individual service tier among ISPs was 70.2 ms, while the lowest average latency within a single service tier was 12.6 ms. This compares to last year’s maximum latency of 74.8 ms and minimum of 14.5 ms.
- Results by technology:
- During peak periods, latency increased across all technologies by 6.5 percent, which represents a modest drop in performance. In 2011 this figure was 8.7 percent.
- Effect of burst speed techniques. Some cable-based services offer burst speed techniques, marketed under names such as “PowerBoost,” which temporarily allocate more bandwidth to a consumer’s service. The effect of burst speed techniques is temporary—it usually lasts less than 15 to 20 seconds—and may be reduced by other broadband activities occurring within the consumer household.21 Burst speed is not equivalent to sustained speed. Sustained speed is a measure of long-term performance. Activities such as large file transfers, video streaming, and video chat require the transfer of large amounts of information over long periods of time. Sustained speed is a better measure of how well such activities may be supported. However, other activities such as web browsing or gaming often require the transfer of moderate amounts of information in a short interval of time. For example, a transfer of a web page typically begins with a consumer clicking on the page reference and ceases when the page is fully downloaded. Such services may benefit from burst speed techniques, which for a period of seconds will increase the transfer speed. The actual effect of burst speed depends on a number of factors explained more fully below.
- Burst speed techniques increased short-term download performance by as much as 112 percent during peak periods for some speed tiers. The benefits of burst techniques are most evident at intermediate speeds of around 8 to 15 Mbps and appear to tail off at much higher speeds. This compares to 2011 results with maximum performance increases of approximately 50 percent at rates of 6 to 7 Mbps with tail offs in performance beyond this.
- Web Browsing, Voice over Internet Protocol (VoIP), and Streaming Video.
- Web browsing. In specific tests designed to mimic basic web browsing—accessing a series of web pages, but not streaming video or using video chat sites or applications—the total time needed to load a page decreased with higher speeds, but only up to about 10 Mbps. Latency and other factors limited response time starting around speed tiers of 10 Mbps and higher. For these high speed tiers, consumers are unlikely to experience much if any improvement in basic web browsing from increased speed–i.e., moving from a 10 Mbps broadband offering to a 25 Mbps offering. This is comparable to results obtained in 2011 and suggests intrinsic factors (e.g. effects of latency, protocol limitations) limit overall performance at higher speeds. It should be noted that this is from the perspective of a single user with a browser and that higher speeds may provide significant advantages in a multi-user household or where a consumer is using a specific application that may be able to benefit from a higher speed tier.
- VoIP. VoIP services, which can be used with a data rate as low as 100 kilobits per second (kbps) but require relatively low latency, were adequately supported by all of the service tiers discussed in this Report. However, VoIP quality may suffer during times when household bandwidth is shared by other services. The VoIP measurements utilized for this Report were not designed to detect such effects.
- Streaming Video. 2012 test results suggest that video streaming will work across all technologies tested, though the quality of the video that can be streamed will depend upon the speed tier. For example, standard definition video is currently commonly transmitted at speeds from 1 Mbps to 2 Mbps. High quality video can demand faster speeds, with full HD (1080p) demanding 5 Mbps or more for a single stream. Consumers should understand the requirements of the streaming video they want to use and ensure that their chosen broadband service tier will meet those requirements, including when multiple members of a household simultaneously want to watch streaming video on separate devices. For the future, video content delivery companies are researching ultra high definition video services (e.g. 4K technology which has a resolution of 12 Megapixels per frame versus present day 1080p High Definition television with a 2 Megapixel resolution), which would require higher transmission speeds.22
- Variability of Performance. In the July 2012 Report, we have added a new category of charts to track variability of performance of a service provider. We have calculated the percentage of users across a range of advertised speeds who, on average, experience performance levels at that speed or better. This information, commonly called a cumulative distribution function, shows how speed is distributed across the population of consumers included in this survey. The result of this metric demonstrates that consumers should be reasonably confident that the performance they receive from their ISP will be consistent with the results included in this Report.
Online Resources
In conjunction with this study, the Commission will make the following associated resources available to the public and research community: electronic copies of the charts included in the Report; data sets for each of the charts in the Report; documentation regarding the underlying methodology by which the data was collected and calculated; tabular results for each test performed for each ISP across all speed tiers; data sets for all recorded data for April 201223 that constitute the basis for the Report; and a complete raw data set for all tests run during the testing period.24 In addition, the Technical Appendix describes the methodology used in the Report. The Commission is releasing this material in the hope that independent study of this data set will provide additional insights into consumer broadband services.
- July 2012 Report: fcc.us/mba0712report
- July 2012 Technical Appendix: fcc.us/mba0712appendix
- Charts in July 2012 Report: fcc.us/mba0712charts
- Validated Data Set (for charts in July 2012 Report): fcc.us/mba0712validdataset
- Methodology Resources (how data collected and calculated): fcc.us/mba0712methodology
- Tabular Test Results (data sets recorded in April 2012): fcc.us/mba0712testresults
- Raw Bulk Data Set (complete, non-validated results for all tests run during the testing period): fcc.us/mba0712rawbulkdataset
- August 2011 Report, Technical Appendix, and Data Sets: fcc.us/mba0811report
Description of Tests Included in Report
The July 2012 Report is based on 13 separate measurements that could be used to characterize various aspects of broadband performance to the consumer’s home. The ISPs that participated in the study agreed to base the Report on a full month of data,25 and participants in the study agreed to April 2012 as the test month. April data were verified and are analyzed in this Report. Active data collection continued after April, and while this subsequent data set has not been verified or analyzed, it is included in the Raw Bulk Data Set that will be released to the public.26
As in the August 2011 Report, this Report emphasizes two metrics that are of particular relevance to consumers: speed and latency. Broadband throughput or speed, commonly expressed in Megabits/second or Mbps, is the primary performance characteristic advertised by ISPs. Broadband speed is the average rate at which information “packets” are delivered successfully over the communication channel. A higher speed indicates a higher information delivery rate. A 10 Mbps service should, in theory, deliver ten times as much information as a 1 Mbps service in a given period of time.
The use of transient performance enhancements such as burst techniques, that are available as a part of many cable-based services, present a technical challenge when measuring speed. Services featuring burst techniques will deliver a far higher throughput for short periods, usually at the beginning of a download after a brief warm-up period. The duration of the speed burst may vary by ISP, service tier, and other factors. For example, a user who has purchased a 6 Mbps service tier might receive 18 Mbps for the first 10 megabytes27 (MB) of a particular download. As supported by our test, this is of significant benefit to applications such as web browsing, which use relatively short-lived connections and transfer short bursts of data. But once the burst window lapses, throughput will return to the base rate, making the burst rate an inaccurate measure of performance for longer, sustained data transfers. In addition, other household broadband activities may decrease or eliminate the benefit of the speed burst. The speed test employed in this study isolated the effects of transient performance-enhancing services such as burst techniques from the long-term sustained speed, and presents sustained and “burst” speed results separately. Consumers should evaluate the relevance of each capability based upon their specific needs—consumers who use broadband mostly to web browse might find the “burst” speed very relevant; consumers who download many large files might find it less relevant.
Latency is another key factor in broadband performance. For practical reasons, latency measurements typically represent the round-trip latency, i.e., from the consumer to the measurement point and back.28 The impact of latency is felt in a number of ways. For example, high round-trip latencies may compromise the quality of voice services in ways that are perceptible to consumers.29 Even lower latencies, which may not be directly noticeable by human perception, can still degrade network performance. Computer networks and applications are more sensitive to latency than humans. Latency affects the rate of information transmission for TCP protocol, which is commonly used to support Internet applications, and can therefore limit the maximum speed achievable for a broadband service regardless of the actual service speed. In the interactive communications found in computing applications, latency is also additive, which means that the delay caused by the sum of a series of latencies adds to the time it takes to complete a computing process. Thus, latency can have a significant effect on the performance of applications running across a computer network. As service speeds increase, the impact of network latency can become more noticeable, and have a more significant impact on overall performance.
One of the key factors that affects all aspects of broadband performance is the time of day. At peak hours, more people are attempting to use residential broadband connections to access the Internet simultaneously, giving rise to a greater potential for congestion and degraded user performance.
This Report highlights the results of the following tests of broadband speed and latency, as measured on a national basis across DSL-, cable-, and fiber-to-the-home technologies:
- Sustained download speed: throughput in Mbps utilizing three concurrent TCP connections measured at the 25-30 second interval of a sustained data transfer
- Sustained upload speed: throughput in Mbps utilizing three concurrent TCP connections measured at the 25-30 second interval of a sustained data transfer
- Burst download speed: throughput in Mbps utilizing three concurrent TCP connections measured at the 0-5 second interval of a sustained data transfer
- Burst upload speed: throughput in Mbps utilizing three concurrent TCP connections measured at the 0-5 second interval of a sustained data transfer
- UDP latency: average round trip time for a series of randomly transmitted user datagram protocol (UDP) packets distributed over a long timeframe
Overall, a total of 3,088,140,069 measurements were taken across 163,831,495 unique tests.
Test Results
We present the summary of our findings below.30 The Commission is separately releasing a Validated Data Set31 on which this Report was based, and will also release a Raw Bulk Data Set of non-validated data collected outside the reference month. The results below are reported by performance variation, by ISP, and by technology (DSL, cable, and fiber-to-the-home) for the most popular service tiers offered by each ISP. As noted above, we focus on periods of peak consumption. The results presented below represent average32 measured performance across a range of consumers, and while these results are useful for comparison purposes, they should not be taken as an indicator of performance for any specific consumer.
All charts below use data from April 2012 unless otherwise noted. We also include a number of charts comparing data from April 2012 and March 2011 (the data used in the August 2011 Report).
VARIATION BY ISP AND SERVICE TIER IN DELIVERY OF ADVERTISED SPEED
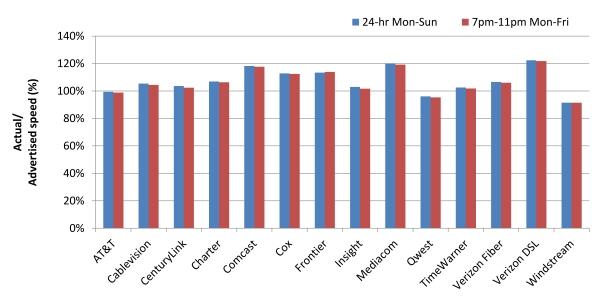
Chart 1 shows actual speed as a percentage of advertised speed over a 24-hour period and during peak periods across all ISPs as shown in the April 2012 test data. In 2012, the majority of ISPs delivered actual download speeds within 90 percent of advertised speeds or better, with modest performance declines during peak periods.33 In 2011, most ISPs delivered actual download speeds within 80 percent of advertised speeds, with modest performance declines during peak periods.34

As shown in Chart 2, upload performance in the April 2012 test data is much less affected than download performance during peak periods. While in 2011 almost all ISPs reached 90 percent or above of their advertised upload rate, in 2012 most ISPs improved to deliver above 100 percent of their advertised rate, even during peak periods.
In general, we found in the April 2012 test data that even during peak periods, the majority of ISPs were providing actual speeds that were generally 90 percent or better than advertised rates, as shown in Chart 3, compared to 80 percent in 2011. Moreover, the variations among ISPs in their ability to deliver advertised speeds were narrower than in 2011.
VARIATION BY ACCESS TECHNOLOGY IN DELIVERY OF ADVERTISED SPEED
The ability to deliver advertised speeds also varied by technology, although both cable and DSL technologies improved this year and are now more similar to fiber technology in their ability to deliver advertised speeds than they were in 2011. As shown in Chart 4, which depicts results from the April 2012 test data, there is some variation by technology in actual versus advertised performance during peak periods, although DSL and cable have improved since 2011. DSL on average meets 84 percent of advertised download speed during peak periods, compared to 82 percent last year; cable meets 99 percent, up from 93 percent. Fiber-to-the-home increased slightly, from 114 percent of advertised speeds in 2011 to 117 percent of advertised speeds in 2012. Upload performance is, as noted, generally better at delivering advertised rates than download performance during peak usage periods, with all technologies on average meeting advertised upload speeds by 107 percent, up from 103 percent in 2011.35
VARIATION BY SERVICE TIER IN DELIVERY OF ADVERTISED SPEED
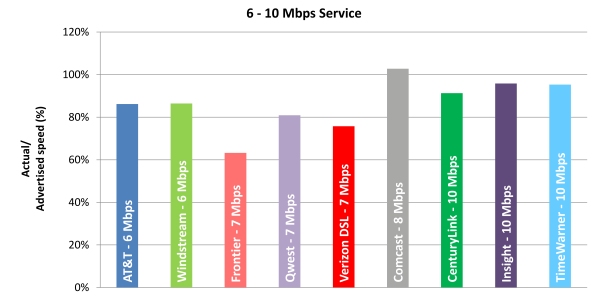
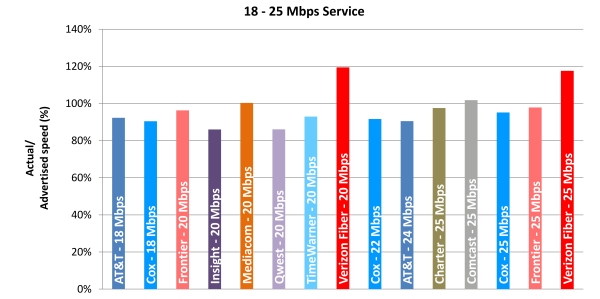
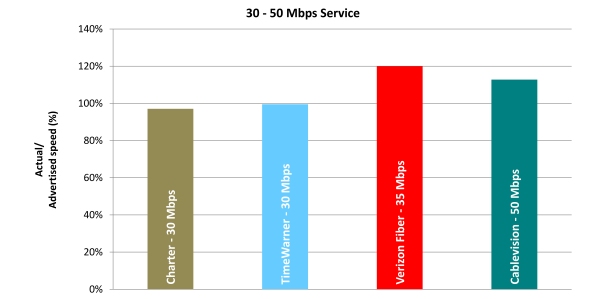
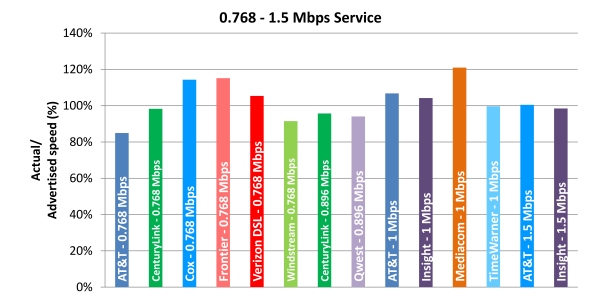
Download Peak Period Throughput
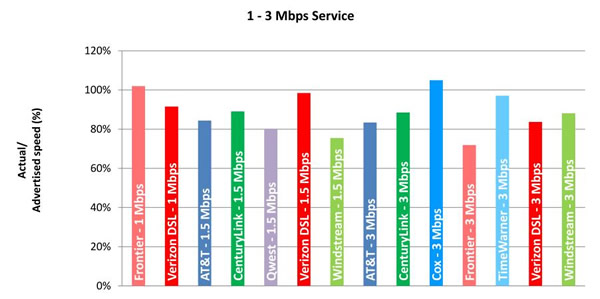
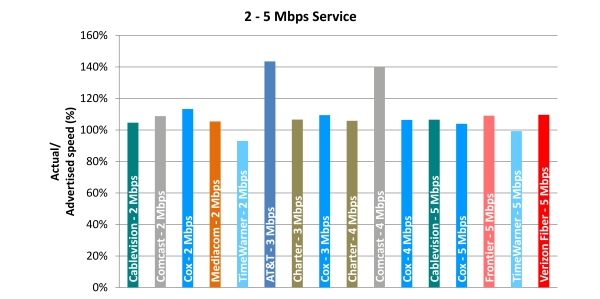
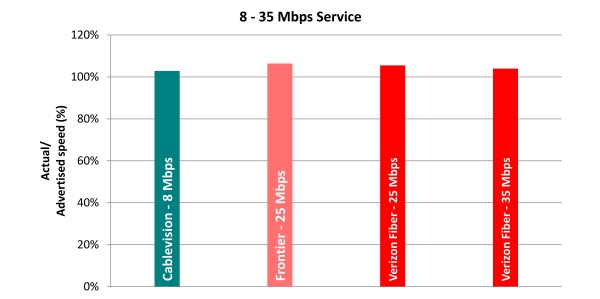
As shown in Charts 5.1-5.5, peak usage period performance varies by service tier among ISPs included in this study during the April 2012 test period. Even during peak periods, the majority of service tiers offer performance levels approximately 90 percent or more of advertised speeds, up from 80 percent in 2011.36 Two ISPs using different technologies (cable and fiber) achieved an average of over 128 percent of advertised rates during peak periods. Other ISPs provide service that is either close to or exceeds advertised rates.

Upload Peak Period Throughput
Consumer broadband services are typically offered with asymmetric download and upload rates, with the download rate many times faster than the upload rate. Since it has been shown that typical consumer usage patterns result in more data being delivered to the consumer than in being uploaded to the Internet by the consumer, it can be more efficient for the ISP to provision its network to provide higher download than upload speeds. To better match consumer needs, some ISPs may offer services providing a choice of upload speeds or even symmetric rates. These decisions are based upon the perception of market needs by the ISP and the capabilities of the technology used by the ISP to provide service.
The ratio of actual to advertised speed for upload performance is generally superior to the ratio measured for download performance. On average across all speed tiers, ISPs deliver at least 95 percent of the advertised upload rate, an increase from 84 percent in 2011. In this Report we found that cable services delivered, on average, 110 percent of advertised upload speed versus 108 percent in 2011; fiber delivered 106 percent of upload speed, down slightly from 112 percent in 2011; and DSL delivered 103 percent upload speed, up from 95 percent in 2011. We found little evidence of congestion among upload speeds with an average drop in performance between 24-hour week day and peak week day results of only 0.5 percent. Charts 6.1-6.4 depict average upload speeds for each ISP by service tier.

Burst Versus Sustained Download Throughput
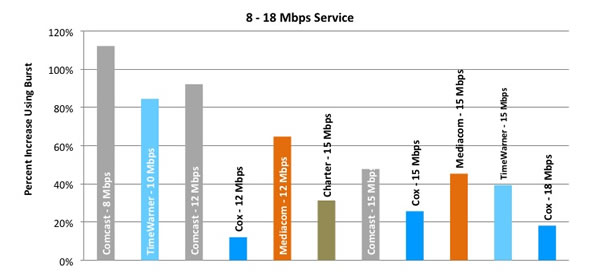
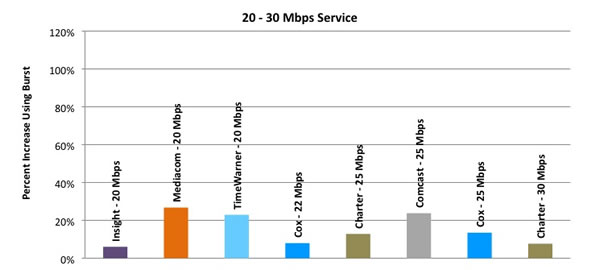
Comparing burst download speeds versus advertised speeds demonstrates the effect that burst services have on data throughput. For DSL- and fiber-to-the-home services, which do not, in general, employ burst technologies, there are no significant differences between sustained and burst measurements. Charts 7.1-7.2 below show the percent increase that burst technology had on initial download performance, if the provider employs this technology, during the April 2012 test period. To create this chart, for each ISP’s service tier, we subtracted the sustained performance from the measured burst performance to highlight the difference between the two, which highlights the performance increase created by burst technology if utilized. Results that showed less than a 5 percent improvement were discarded for readability purposes. Thus, in Charts 7.1-7.2 cable services employing boost technology can be seen to temporarily increase performance by as much as 100 percent depending upon speed tier, achieving performance as high as 112 percent of advertised speeds in the 8-12 Mbps tiers. Charts 7.1-7.2 also show that the effectiveness of burst technology varies among cable ISPs. The effectiveness of burst technology declines at the higher speed tiers.
The use of transient performance boosting features is less prevalent for upstream connections. However, as shown in Chart 8, burst technology in 2012 does appear to be applied to upstream performance by one or more ISPs. For example, in the 2 Mbps speed tier, Comcast shows an approximately 80 percent increase in performance in the burst test as compared to the sustained upload test.

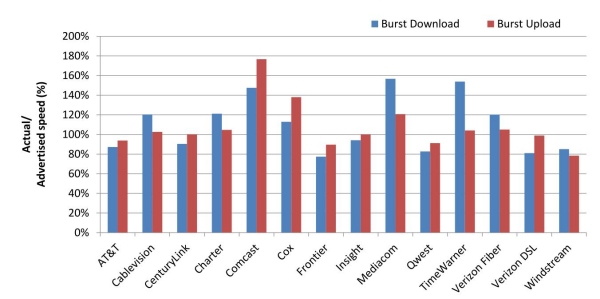
Chart 9 provides an overview of the average burst download and upload speed per ISP as a percent of advertised performance. We note that most ISPs do not employ a burst feature, and Chart 9 is presenting the results of the burst test across all ISPs. Therefore the performance of many ISPs will not be markedly changed from their sustained speed performance. Comcast demonstrates the highest burst upload speed, reaching on average across all speed tiers 150 percent of advertised upload speed, while for download speed Comcast, Mediacom and Time Warner achieve approximately 150 percent of advertised.
Latency
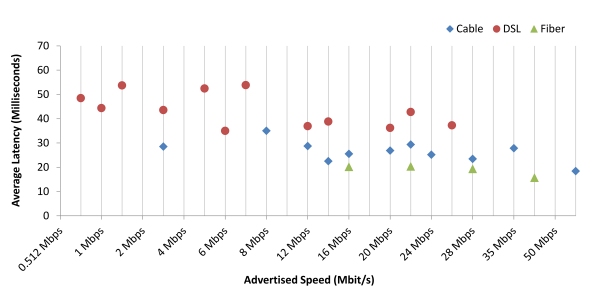
Latency test results in 2012 remained little changed from 2011. We believe this is because the primary causes of latency are intrinsic to the service architecture and not amenable to significant improvement. As can be seen from Chart 10, in 2012 latency varies by technology and by service tier.37 As was true in 2011, fiber-to-the-home has the best performance in terms of latency, with a 18 ms average during the peak period, up slightly from 17 ms in 2011, and cable averages 26 ms, down from 28 ms. DSL averages 43 ms, with little change from 44 ms in 2011. The highest average latency in a speed tier for DSL decreased slightly from 58 ms in 2011 to approximately 53 ms in 2012.38 The highest latency recorded for a single ISP was found to be 70 ms, slightly down from 75 ms recorded for this same ISP in 2011. While the test results found variance in latencies among technologies, all of the latencies measured here should be adequate for common latency-sensitive Internet applications, such as VoIP.
Chart 10: Average Peak Period Latency in Milliseconds, by Technology—April 2012 Test Data
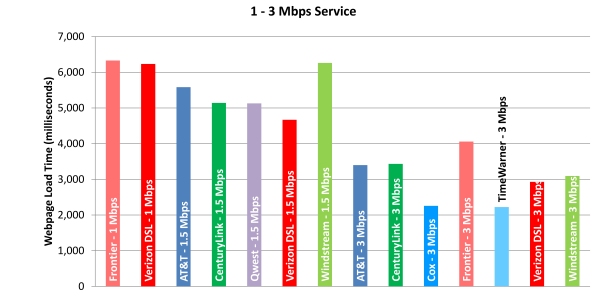
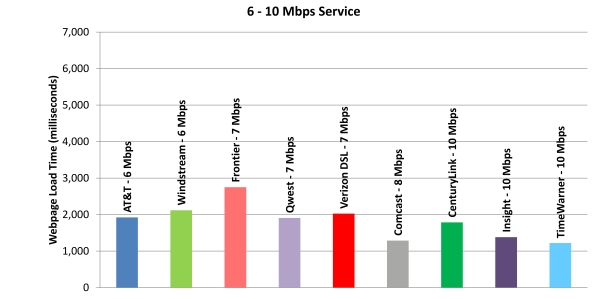
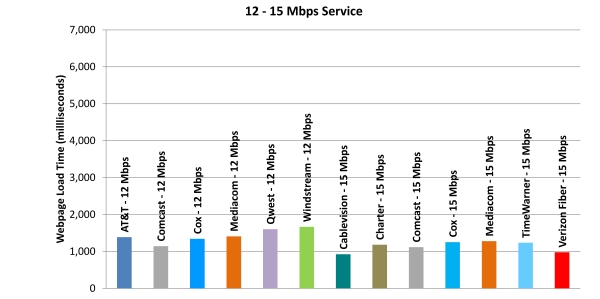
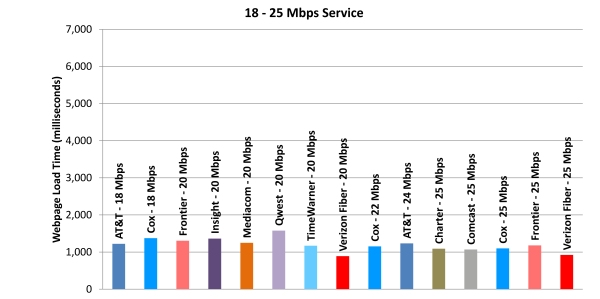
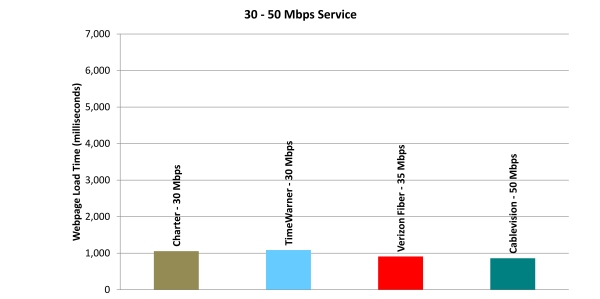
Charts 11.1-11.5 displays average web page loading39 time by speed tier for the April 2012 test data period. Web pages load much faster as broadband speed increases, but beyond 10 Mbps, performance increases for basic web browsing lessen dramatically. There also appear to be differences in web loading times by service provider at these higher speeds. The data indicate that a consumer subscribing to a 10 Mbps speed tier is unlikely to experience a significant performance increase in basic web browsing—i.e., accessing web pages, but not streaming video or using other high-bandwidth applications such as video chat—by moving to a higher speed tier. These results are largely consistent with and show no significant improvement over 2011 results. Web page download speeds at higher rates are limited by intrinsic factors (e.g. service architectures, latency and protocol effects) and not easily improved at the current time. Research is ongoing to improve overall Internet service performance and future improvements in performance may be possible. Note that in Charts 11.1-11.5, lower bars indicate shorter load time, and therefore better performance.
Chart 11.1: Web Loading Time by Advertised Speed, by Technology (1-3 Mbps Tier)—April 2012 Test Data
VARIATION BY TIME OF DAY IN DELIVERY OF ADVERTISED SPEED
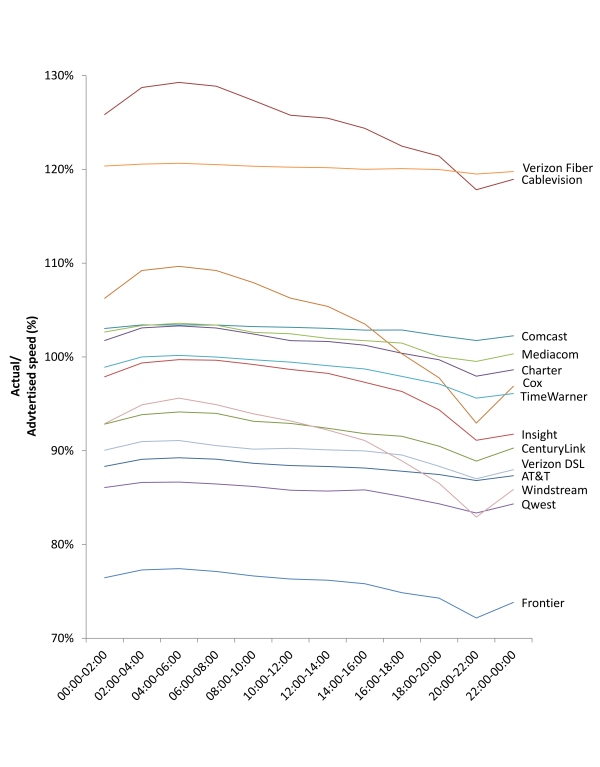
Chart 12 shows that in 2012, performance during the day varies for most technologies. During idle periods there is more capacity available for the consumer, while at peak usage periods, with many consumers online, available capacity per consumer diminishes. As noted earlier in this Report, since 2011 ISPs have both improved performance and have provided more reliable estimates of actual speeds to consumers.
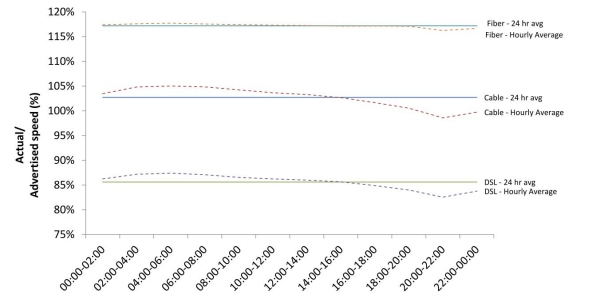
24 HOUR VERSUS PEAK PERFORMANCE VARIATION BY TECHNOLOGY
Chart 13 compares the average hour-by-hour performance download speed performance for fiber, cable, and DSL technologies to the 24-hour average speed for each technology. Performance of all technologies fluctuates slightly during the day. For example, while cable technology has a daily 24-hour average speed of slightly over 100 percent of advertised rates, it achieves this by delivering slightly higher than average performance during non-peak hours and slightly lower performance during peak periods. Fiber technology is least affected by traffic loads, showing a very slight dip in performance during peak periods, with cable and DSL technologies delivering better performance during non-peak periods and dipping slightly below advertised performance during peak usage periods.
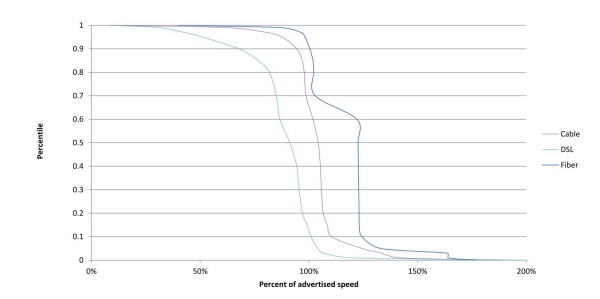
CUMULATIVE DISTRIBUTION FOR DOWNLOAD SPEEDS
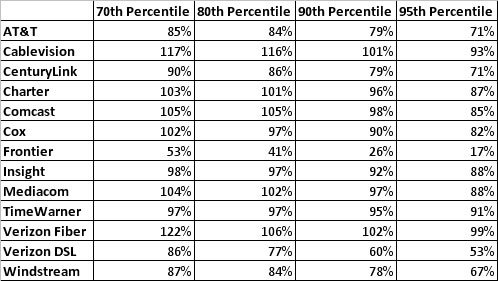
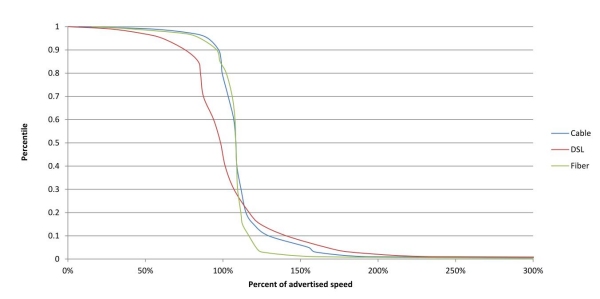
In this Report we are adding cumulative distribution charts to provide some illustration of how broadband performance varies within the sample population. In theory, test results for a particular ISP could return an average performance level that was achieved with an extreme variance in the population. For example, an ISP that delivered well over 100 percent of advertised speed to some subscribers might deliver well under 100 percent of advertised speed to other subscribers and still deliver, on average, 100 percent of advertised speed. The cumulative distribution accounts for this by showing the percent of subscribers to a particular speed tier who experience an average or greater level of performance. For example, if the 90th percentile of the chart intersected with 80 percent of advertised speed, it would indicate that 90 percent of the population is receiving performance of 80 percent or better of advertised speed and that the remaining 10 percent of the population is receiving performance less than 80 percent of advertised speed. We believe that the cumulative distribution charts below provide some reassurance that extreme variance is not resulting in misleading averages. In other words, the average performance numbers used elsewhere in this Report should do a good job of indicating the likely performance for any individual user of a particular ISP and tier. From Chart 14 it can be seen that in 2012 at the 80th percentile fiber consumers are receiving 102 percent or better of advertised rates, cable consumers are receiving 98 percent or better, and DSL consumers are receiving 82 percent or better of advertised rates. At the 90th percentile, fiber consumers are receiving 100 percent or better of advertised rates, cable consumers are receiving 94 percent and DSL consumers 68 percent of advertised rates. It is worth noting that unlike fiber or cable technologies, DSL performance decreases with the length of the cable connecting the DSL subscriber to a broadband aggregation point maintained by the service provider. Thus, DSL subscriber performance will vary as their cable distances vary from this aggregation point.
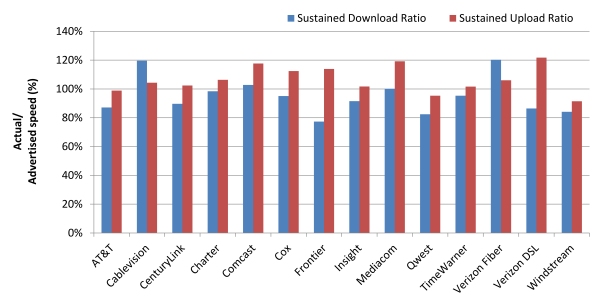
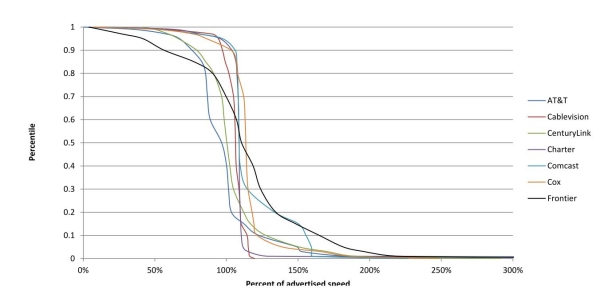
Charts 15.1-15.2 show the cumulative distribution of sustained download speeds by provider. To clarify the data, we have divided the performance of the thirteen ISPs into two charts, with the providers divided into alphabetical order.
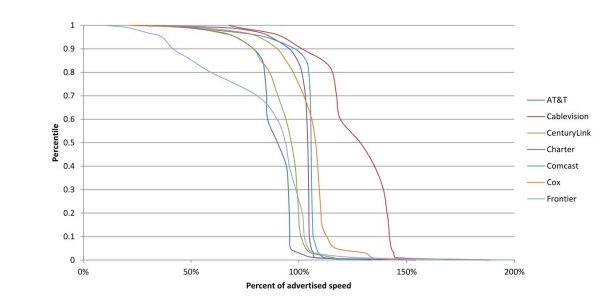
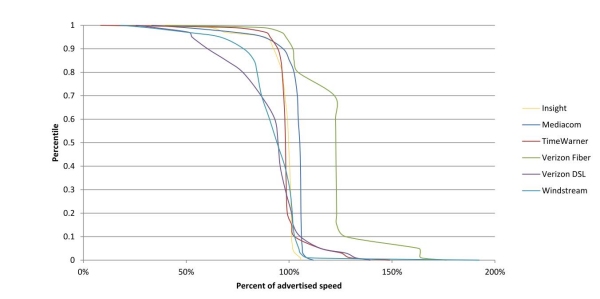
For easier readability, we have also included the CDF data illustrated in Charts 15.1-15.2 as Figure 1.
CUMULATIVE DISTRIBUTION FOR UPLOAD SPEEDS
As with the cumulative distribution charts for download speeds, Chart 16 shows the percent of subscribers to a particular speed tier who experienced an average or greater level of upload performance in 2012, while Charts 17.1-17.2 show the same results by provider, with the results again split into two charts alphabetically for legibility. These results suggest that DSL, cable, and fiber return even more consistent performance, with fewer outliers, for upload than for download speeds.

YEAR BY YEAR COMPARISON
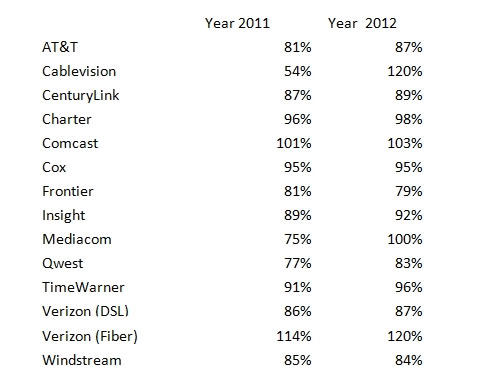
Figure 2 shows a year-to-year comparison for peak period average download speeds as a percentage of advertised speed. Nearly every ISP is doing a better job this year than last year of delivering actual performance consistent with advertised performance.
ACTUAL VERSUS ADVERTISED SPEEDS
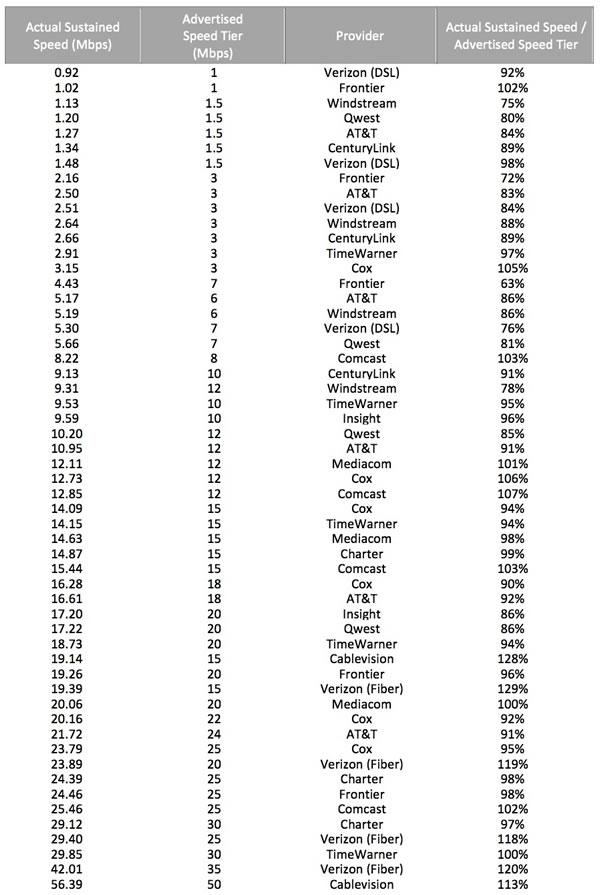
Figure 3 below lists the advertised speed tiers included in this study, and compares this with the actual average peak performance results from April 2012. As before, we note that the actual sustained download speeds here were based on national averages, and should not be taken to represent the performance experienced by any one consumer in any specific market for these ISPs.
Figure 3: Peak Period Sustained Download Performance, by Provider—April 2012 Test Data
DATA CONSUMPTION
Throughout this study, test traffic is tracked and subtracted from each panelist’s actual data usage. The April 2012 data was taken from a subset of 6,204 measurement devices that were active during the measurement period,40 that reported a total of 316.32 terabytes41 of data consumed, which represents the amount of data uploaded and downloaded through all measurement devices across the panel, minus traffic associated with the execution of Measuring Broadband America performance measurements. Chart 18 shows the average amount of data traffic consumed by users in each speed tier normalized as a percentage of total traffic generated by all consumers. In effect, we compute the ratio of the mean measurement device consumption rate for a specific tier and the mean measurement device consumption rate across all tiers. This normalized view of user traffic shows a correlation between data consumption and speed tiers. In general, the higher the speed tier the more data consumed by the average user. This supports a view that as higher speeds are made available to consumers, consumers increase the amount of data they consume, presumably through some combination of greater use of the Internet and adoption of more data-intensive applications and services. In other words, consumers appear to take advantage of faster speeds not simply to do what they would otherwise do faster, but to do more with their Internet connection.
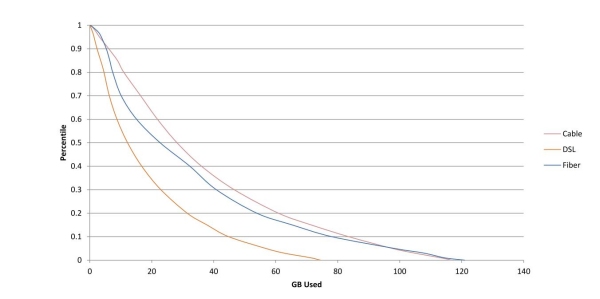
Chart 19 shows the cumulative distribution function of traffic by technology demonstrating how much traffic was consumed by different percentages of users. One important note about the data consumption information presented in this Report: The panel methodology specifically attempted to exclude users with high consumption profiles and very fast tiers that had relatively low subscription rates. For these and other reasons, while the data do show a correlation between speed tier and data consumption, no conclusions can be drawn about total data consumption by broadband subscribers. In other words, while Chart 19 does not show data consumption above roughly 120 GB, that does not mean that typical broadband subscribers do not consume more than that amount each month, just that such subscribers would be excluded by the methodology of the Report.
Chart 18: Normalized Average User Traffic—April 2012 Test Data

Chart 19: Cumulative Distribution of User Traffic, by Technology—April 2012 Test Data
PANELIST MIGRATION
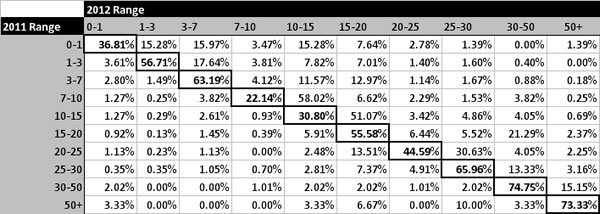
From the original 2011 study, 5,557 panelists continued to participate in 2012 and to report data in April 2012. Figure 4 provides a percentage comparison of the 2,647 panelists who were part of the initial study in 2011 and migrated to a different speed tier between the March 2011 and April 2012 data collection periods. This table only includes panelists who were in both the 2011 and 2012 study. The highlighted boxes show the percentage of panelists who stayed in each tier from 2011 to 2012; the boxes to the left and right of those highlighted represent panelists who decreased or increased their speed, respectively, during this period.
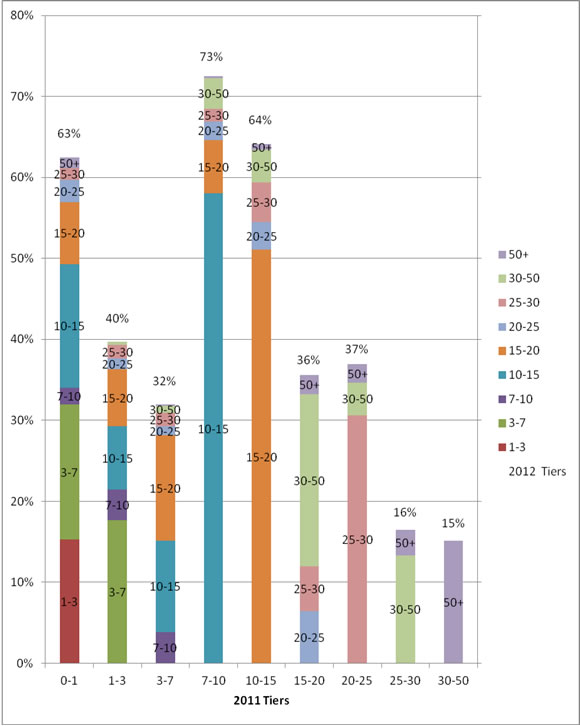
As indicated earlier, panelists in 2012 were, on average, subscribing to higher speed tiers than were panelists in 2011. Chart 20 shows the percent of 2011 panelists that were subscribed to a higher tier in April 2012. The bars indicate the percentage of panelists from each of the 2011 tiers that had moved to a higher tier by the April 2012 testing period. The largest increases can be observed in the 7-10 Mbps, 10-15 Mbps, and 0-1 Mbps tiers where providers have made company-wide upgrades to subscriber tiers.42 Notably, 63 percent of panelists who in March 2011 subscribed to a less than 1 Mbps tier had moved to a higher speed tier by April 2012, as had 73 percent of subscribers in 2011 to a 7-10 Mbps tier, and 64 percent of subscribers to a 10-15 Mbps tier. The tiers that panelists in the 2011 study moved to in 2012 are shown in Chart 21, and demonstrate that many subscribers moved to a tier in the next higher band.
Chart 20: Percent Change of 2011 Panelists Subscribed to Higher Tier in 2012 Study
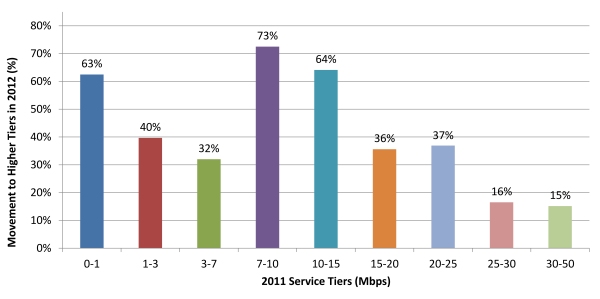
Chart 21: Percent Change of 2011 Panelists Subscribed to Higher Tier in 2012 Study
Conclusion and Next Steps
In just the year since we collected data for our last Report, ISPs have improved in both their ability to deliver what they promise to their customers, and in the overall speeds they can and are delivering. This is a success story, and indicates strong progress toward the important goals set forth in the NBP, that by 2015, 100 million homes should have affordable access to actual download speeds of 50 Mbps, and by 2020 the actual download speed should have increased to 100 Mbps. Though we are making progress toward these goals, we have not yet reached them, and to ensure success it is essential that ISPs continue to improve at the impressive pace indicated by this Report.
In reviewing this Report, it is important to keep in mind that it only provides information on certain aspects of the consumer broadband experience in the U.S. This Report covers ISPs that provide residential broadband to most, but not all, U.S. customers. This Report does not address affordability or other characteristics of service, such as data caps and usage-based pricing, which might have a large impact on how consumers can use their broadband connections. Despite these limitations in the scope of the Report, the areas covered by this Report show ISPs generally performing well and improving on last year’s performance.
Expanding Measurement to Additional Technologies
Although this Report was limited to DSL, cable, and fiber-based services, the Raw Bulk Data Set from April 2012 includes measurements from two satellite providers and one fixed wireless provider. In future Reports, we plan to expand this study to include satellite broadband, as well as fixed wireless technologies. Both satellite and fixed wireless technologies are particularly useful for serving remote or sparsely populated areas, and one of the Commission’s goals is to expand broadband availability and adoption in rural and traditionally underserved areas. In addition, the Commission is pursuing ways to ensure that mobile broadband consumers have detailed and accurate information about actual mobile broadband performance.
Continue Dialogue with the Stakeholder Community
The collaborative effort across project participants significantly helped the development of the testing methodologies, sampling techniques, and consumer privacy protections that were critical to this Report. We intend to continue this collaborative effort, and to explore ways testing can be made more efficient, scalable, and reliable. An ongoing assessment of broadband performance across all regions of the country, demographic groups, technologies, and speed tiers would be helpful in many ways. In particular, we hope to expand the measurement program to capture more communities, including rural communities that traditionally have had more limited access to high speed broadband.
Academic Code Review
Both the Commission and SamKnows recognize that while the methodology descriptions included in this document provide an overview of the project as a whole, there will be experts, as well as members of the public and non-profit organizations, who are willing to contribute to the project by reviewing the actual software used in the testing. SamKnows welcomes review of its software and technical platform for non-commercial purposes only.
All Data Released into the Public Domain
In the interest of transparency and to support additional research, the full Raw Bulk Data Set acquired during this study will be made available to the public.43
Acknowledgements
This Report benefited from the voluntary participation of a number of parties. The contribution of their expertise to the development of the methodologies employed in this Report materially increased its quality. We would like to extend our thanks to the following entities:
- Adtran
- AT&T
- Cablevision Systems Corporation
- CenturyLink
- Charter Communications
- Comcast
- Corning
- Cox Communications
- Fiber to the Home Council
- Frontier Communications Company
- Georgia Institute of Technology
- Genband
- Insight Communications
- Intel
- Internet Society
- JDSU
- Mediacom Communications Corporation
- Massachusetts Institute of Technology
- M-Lab
- Motorola
- National Cable & Telecommunications Association
- New America Foundation
- Qwest Communications
- Time Warner Cable
- US Telecom Association
- Verizon
- Viasat
- Windstream Communications
Finally, we again thank SamKnows for their performance during this endeavor, as they remain critical to this study’s success.
ENDNOTES
1 See National Broadband Plan (NBP), available at www.broadband.gov/plan/.
2 The August 2011 Report and its supporting data sets can be accessed at fcc.us/mba0811report.
3 As described in more detail below, both the August 2011 Report and the July 2012 Report were based on the results of testing that took place over a one month period, and do not represent performance over an entire year.
4 Although the data collected in March 2011 were not published until August 2011, each ISP had real-time access to its own performance data throughout the testing period, and so was able to implement changes to improve on that performance once the testing period had been completed. Similarly, all ISPs participating in the April 2012 testing period were able to access their performance data as it was received, and to act on that data accordingly.
5 See Technical Appendix discussion of how panelists were chosen at 3-8.
6 ISPs typically quote speeds or information rates in units of Megabits (millions of bits) per second, known as Mbps. A bit is the basic unit of information in computing.
7 NBP, supra at 9.
8 For example, a panelist who subscribes to a cable-based ISP but who uses a DOCSIS 2.0 or DOCSIS 1.1 modem may find that higher speeds exceed the maximum speed capability of their device. Customers who are purchasing speeds in excess of 100 Mbps should also make sure that the network adapters on their computers and other devices can accommodate such high speeds.
9 As described more fully in the Technical Appendix, this study allowed for a target deployment in up to 10,000 homes across the United States, and the final volunteer pool was created from over 75,000 initial volunteer broadband subscribers. Although test results were taken from 8,011 households reporting data in April 2012, the results that are analyzed in this report reflect broadband performance to approximately 7,800 homes during that month.
10 Verizon’s FiOS service is one example of an Internet service using optical fiber technology. Other services use fiber optic technology and may be marketed as “fiber.” In contrast, AT&T’s U-Verse is a service mark supporting a bundled service package of voice, video, and Internet services which incorporates multiple technologies: the most common arrangement is a fiber-to-the-node architecture with DSL technology terminating to the home. Most U-Verse panelists tested during this survey utilized DSL technology.
11 We appreciate the importance of other technologies, such as satellite and fixed wireless, and hope to include them in future reports.
12 Participating ISPs were: AT&T (DSL); Cablevision (cable); CenturyLink (DSL); Charter (cable); Comcast (cable); Cox (cable); Frontier (DSL/fiber); Insight (cable); Mediacom (cable); Qwest (DSL); TimeWarner (cable); Verizon (DSL and fiber-to-the-home); and Windstream (DSL).
13 Sustained speeds are described in the Technical Appendix and are averaged over five second intervals across the high and low rates that might dynamically occur in very short time interval measurements.
14 ISPs typically advertise a certain number of speed tiers but must support legacy tiers—tiers promoted at one time but no longer offered for new subscription—until subscribers are migrated to higher speeds. During deliberations with ISPs for this trial, some noted that they maintain a larger number of service tiers than they currently promote and advertise and that they may support as many as ten service tiers at a given time.
15 This was a result of the limited number of measurement devices—approximately 10,000—that could be deployed over the course of the project. Region-specific data would have required an order of magnitude or greater deployment of equipment, at a corresponding increase in cost.
16 Measurement Lab (M-Lab) is an open, distributed server platform for researchers to deploy Internet measurement tools.
17 The term “average” applied to results in this report always means the arithmetic mean of the sample set under consideration. There is no weighting of samples in calculating averages.
18 Although DSL-based services demonstrated overall performance that was somewhat slower and more subject to latency than cable and fiber-to-the-home, DSL may be less expensive than either of the other technologies discussed in this report, which could be a considerable benefit to some consumers, and a significant factor in their choice of broadband provider.
19 A 24-hour average was computed each day and then averaged over Monday through Sunday.
20 In this context, the closest server is the measurement server providing minimum round-trip time.
21 For example, downloading a large file while browsing the web would limit the effectiveness of burst technology.
22 Discussions with ISPs have indicated that they are beginning to study the potential for, and impact of, ultra high definition video, sometimes called 4K, for the horizontal resolution of approximately 4,000 pixels.
23 The August 2011 report was based on data collected during the month of March 2011. Network anomalies that were observed during March 2012 led to a decision not to use that month’s data as a basis of comparison across all ISPs. A decision was made by the Commission in discussions with SamKnows and the participating ISPs to use the month of April 2012 as the final data source for this Report. Additional testing and verification procedures were instituted following the March incident to more readily identify network issues and minimize the loss of data. A few specific testing days from April 2012 were also excluded from the final data source for this report after anomalies affecting a subset of the data for those days were observed. These events are discussed in greater detail in the Technical Appendix. We expect that M-Lab will issue a technical report addressing testing anomalies after completing its analysis.
24 In addition to the various data sets, the actual software code that was used for the testing will be made available for academic and other researchers for non-commercial purposes. To apply for non-commercial review of the code, interested parties may contact SamKnows directly at team@samknows.com, with the subject heading “Academic Code Review.”
25 See supra note 23.
26 Available at fcc.us/mba0712rawbulkdataset.
27 A byte is a standard unit of measure in computing indicating 8 bits. A megabyte represents 8 million bits.
28 Latency is often colloquially called the “ping time,” named after a network tool used to measure the latency. The measurement methodology used in this report differs slightly from that tool, but measures the same round trip transit time between two points.
29 See International Telecommunication Union (ITU), Series G: Transmission Systems and Media, Digital Systems and Networks; International Telephone Connections and Circuits—General Recommendations on the Transmission Quality for an Entire International Telephone Connection, G.114 (May 2003).
30 As noted earlier, the full results of all 13 tests that were run in April 2012 are available at fcc.us/mba0712testresults.
31 The April 2012 data set was validated to remove anomalies that would have produced errors in the report. This data validation process is described in the Technical Appendix.
32 For a discussion of how averages were calculated for the purposes of this report, see supra note 17.
33 Results from a particular company may include different technology platforms (e.g., results for Cox include both their DOCSIS 2.0 and DOCSIS 3.0 cable technologies; results for Verizon include both DSL and fiber). Throughout this Report, results are recorded separately for CenturyLink and Qwest. These two entities completed a merger on April 1, 2011; however, they continue to integrate operations in 2012. Similarly, Insight Communications was acquired by Time Warner on August 13, 2011. To ensure continuity testing in April 2012, we continued to measure subscribers of the formerly distinct ISPs separately.
34 For a comparison of 2011 and 2012 download speeds, see Figure 1, supra at 37.
35 As noted elsewhere, see supra note 17, all averages used in this Report are unweighted arithmetic averages of the relevant data sets. However, the sample plan was based on market share data for all ISPs. Comparison of unweighted averages with averages weighted by market share showed close agreement.
36 Only 20 out of 59 service tiers tested in this study returned less than 90 percent of advertised performance during peak periods.
37 We provide latency figures for peak periods. As noted earlier, latency during peak periods was seen to increase by about 2.28% across all technologies. Latencies measured for other periods can be found in fcc.us/mba0712testresults.
38 See fcc.us/mba0712testresults.
39 For a definition of web loading time, see Technical Appendix at 23-24.
40 For a discussion of the measurement devices used in this study, see Technical Appendix at 16-18.
41A terabyte is 1000000000000 bytes or 1000 gigabytes.
42 The speed tiers measured in the 2012 study are described in detail in the Technical Appendix at 29-30.
43 Available at fcc.us/mba0712rawbulkdataset.
Issued: July 20 2012