Science Features
 Loading Page...
Hurricane Sandy Resources
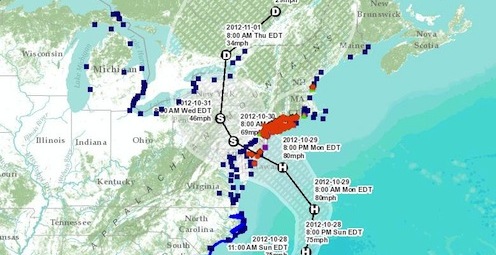
More than 160 USGS scientists, technicians, and specialists are responding to Hurricane Sandy’s aftermath, from Virginia to Massachusetts. Crews from USGS are working hard to retrieve data for emergency managers.
Hurricane Sandy’s impacts have been significant. Many USGS tidal sensors recorded peaks of record and several were completely overtopped. In addition, high-water marks flagged by USGS crews show sizeable storm surge, including 18.98 feet at Long Branch, NJ; 12.93 feet at the Verazzano Narrows Bridge between Brooklyn and Staten Island, NY; and 7.43 feet at Lindenhurst on Long Island, NY.

USGS scientist recovers storm surge sensor in Annapolis, MD.
Storm-Surge Sensors
USGS crews are currently out retrieving the more than 150 storm-surge sensors that were deployed prior to Sandy’s landfall. These sensors extended from the mouth of the Chesapeake Bay in Virginia to the coast of Maine.
The data from these sensors will be used to create models of the precise time the storm-tide arrived, how ocean and inland water levels changed during the storm, the depth of the storm-tide throughout the event, and how long it took for the water to recede.
This information gathered is being used to assess storm damage, discern between wind and flood damage, and improve computer models used to forecast future coastal change.
All data collected by these sensors and the existing USGS streamgage network are available on the USGS Storm-Tide Mapper.
High-Water Marks
In addition, at the request of FEMA, USGS scientists are marking high-water marks. Crews in New York currently have 150 sites they are checking, many established in the 1992 Noreaster that struck the Long Island area. New Jersey crews have an additional 100 sites they are checking along the Atlantic shoreline as conditions are safe to do so. USGS scientists from Maryland, Delaware, Connecticut, and Rhode Island are also be looking for high-water marks in their areas.

USGS scientist Kerry Caslow using RTN GPS surveying to establish an elevation for a storm-tide sensor in New Jersey. Photo credit: Chris Smith, USGS.
High-water marks serve a very important function in assessing damage. USGS crews look for sustained high-water marks, meaning indications of the highest level the water stayed for a time. Because water-levels change often due to wave action, sustained high-water marks allow USGS scientists to determine the levels the water stayed at long enough to cause significant impacts.
High-water marks are useful in determining the amount of damage sustained due to flooding and storm surge. Impact models use high-water marks to determine likely levels of damage to a building’s structural integrity, as well as potential scour damage. Scour damage is the abrasive erosion caused by dissolved solids in water rubbing against buildings or other structures that can wear away the surface, eventually leading to instability.
In addition, FEMA uses high-water marks to determine what damage comes from wind and what damage comes from water when formulating their own impact models.
Coastal Change
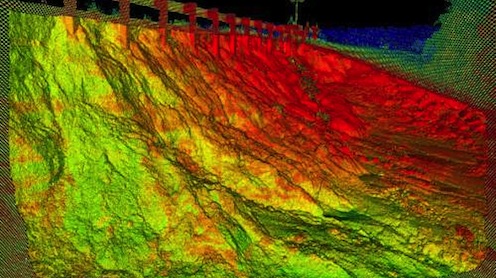
In addition, USGS crews have returned to coastal New Jersey and Long Island to do lidar surveys for before and after studies of coastal change, using the pre-storm lidar surveys taken October 26th and 27th.
Also, USGS crews will conduct aerial surveys from Cape Hatteras, North Carolina, to Montauk, New York. These surveys will include oblique aerial photography and lidar topography. The photographs will be compared to pre-storm photography for a qualitative look at coastal erosion, while the lidar data will be compared to pre-storm beach elevations to quantify actual changes in the beach, such as dune erosion and overwash.
Water Quality
USGS crews have also performed water quality sampling at various locations, including the Delaware River near Trenton, New Jersey; from the Potomac River and the Eastern Shore in Maryland; various sites in Washington, DC, and sites throughout Northern Virginia.

Oblique aerial photographs of Fire Island, New York, at Pelican Island before and after Hurricane Sandy impacts shows coastal change on an undeveloped coastline.

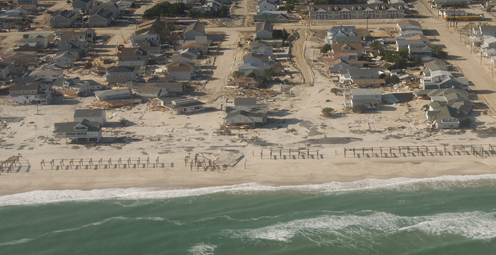
Oblique aerial photographs of Seaside Heights, New Jersey, before and after Hurricane Sandy impacts shows coastal change on a developed coastline.
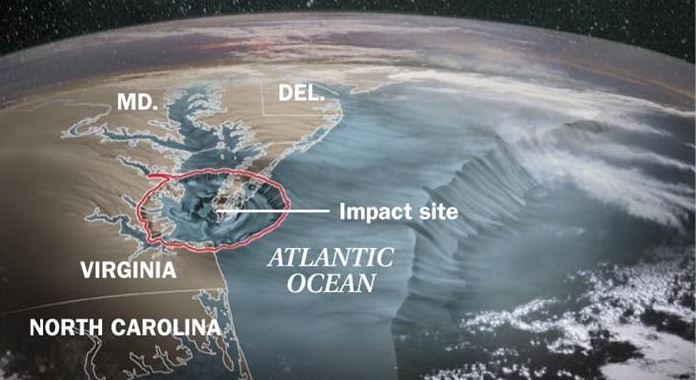
It did, 35 million years ago.
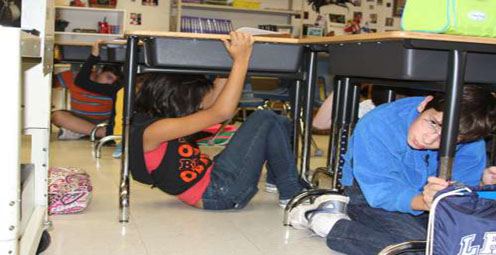
You are encouraged to participate in the Great Central U.S. ShakeOut earthquake drill to be held on Thursday, February 7, 2013. Read more
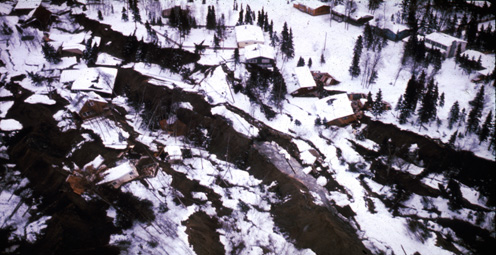
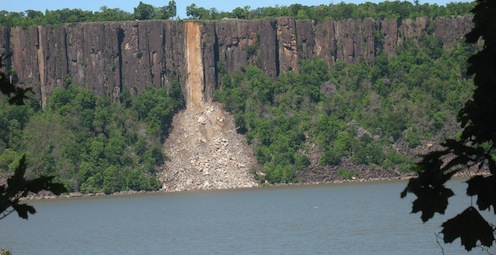
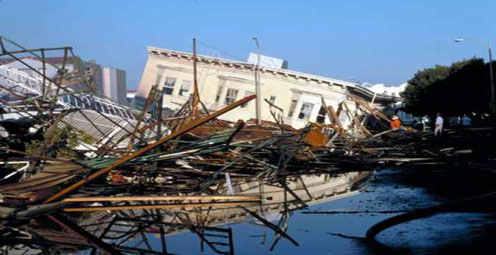
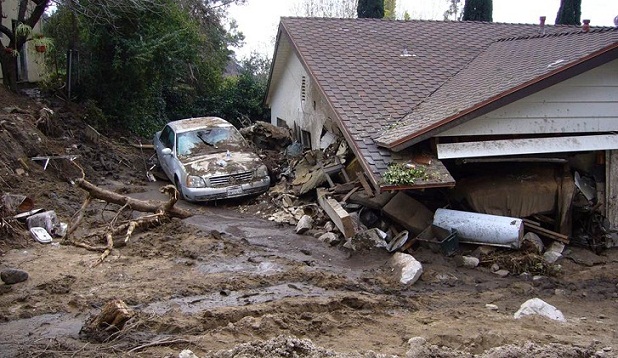
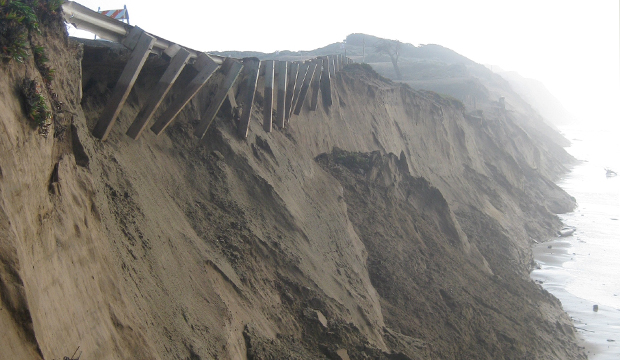
Landslides and debris flows are common and destructive geologic hazards that can happen every year in every U.S. state. Read more
The USGS is providing up-to-date information. Read more
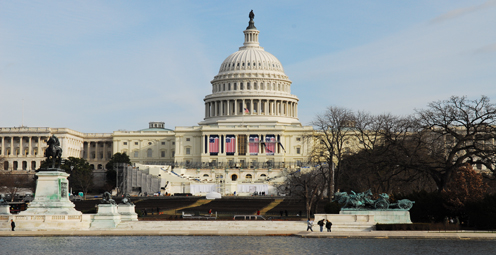
Washington, D.C., is a unique city full of landmarks and buildings that are recognizable worldwide. But how were these stone giants built? Read more
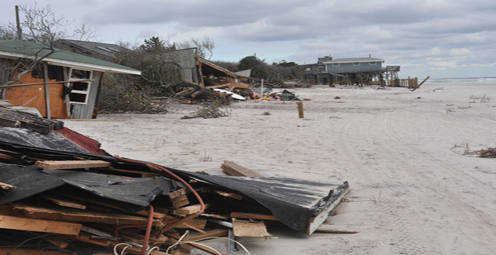
Hurricane Sandy is a stark reminder of just how essential it is for the Nation to become more resilient to coastal hazards.Read more
The USGS is providing up-to-date information. Read more
The USGS is providing up-to-date information. Read more
Learn about USGS science on the processes that cause coastal change. Read more
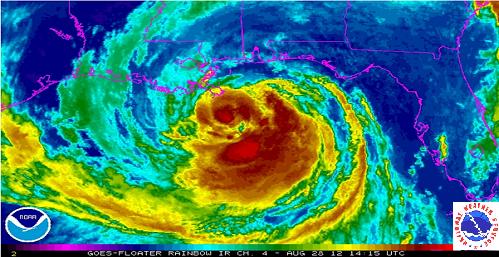
USGS is keeping careful watch as Hurricane Sandy continues to track northeast along the east coast of Florida and the Atlantic coast.
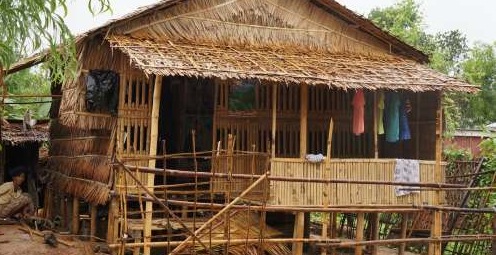
There is an urgent need for steps to mitigate earthquake risk in Burma, as it is not a question of “if” future large earthquakes will occur, but rather “when.” Read more
The USGS has just issued a landslide alert for parts of Maryland, Delaware, and northern Virginia. Read more
The USGS is providing up-to-date information. Read more
USGS is keeping careful watch as Hurricane Sandy continues to track northeast along the east coast of Florida and the Atlantic coast.
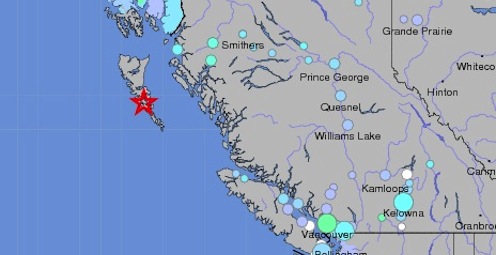
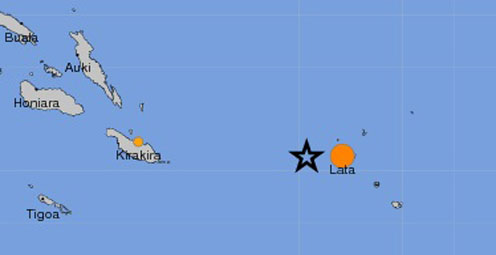
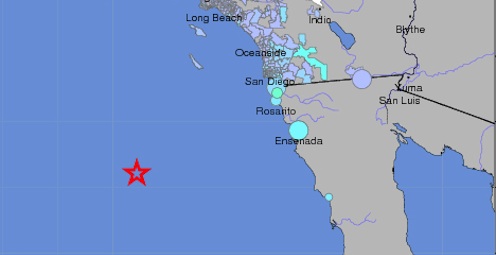
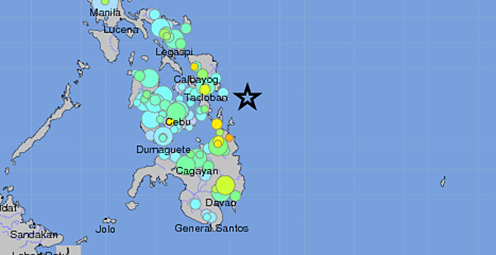
The earthquake struck off the west coast in the Pacific. The USGS is providing up-to-date information. Read more

Are you prepared for future earthquakes? Sign up and participate in a worldwide earthquake drill. Read more
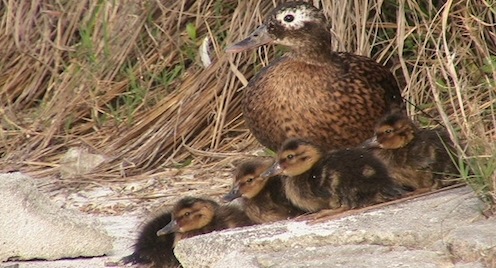
Critically endangered birds whose numbers grew rapidly after successful translocations by USGS and USFWS biologists likely took a hit from the 2011 event. Read more
USGS science helps people understand and prepare for natural hazards. Read more
While Hurricane Isaac has passed, scientific work to understand the storm’s impact on Gulf Coast states continues. Read more
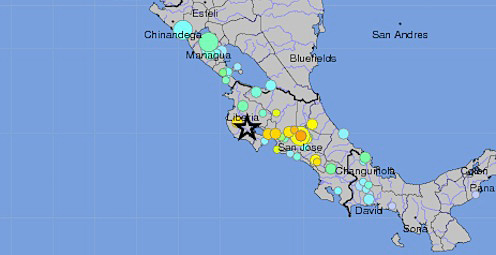
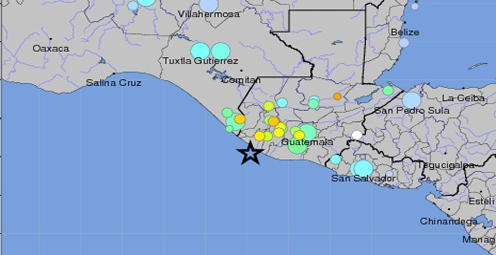
A magnitude 7.6 earthquake struck near the west coast of Costa Rica on September 5, 2012 at 14:42:10 UTC. Read more
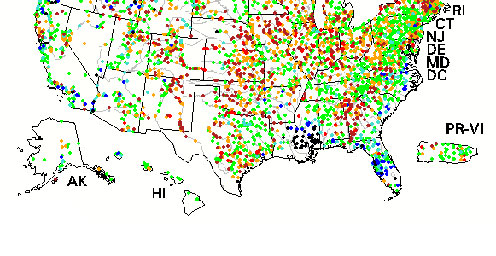
Real-time map showing the extent of flooding (black dots) and drought (red dots) in the U.S. Read more
USGS scientists, engineers, and technicians are working along the Gulf coast in response to Hurricane Isaac. Read more
USGS scientists are providing up-to-date information. Read more
The U.S. Geological Survey is keeping careful watch as Tropical Storm Isaac continues to track northwest toward the west coast of Florida and the Gulf of Mexico. Read more
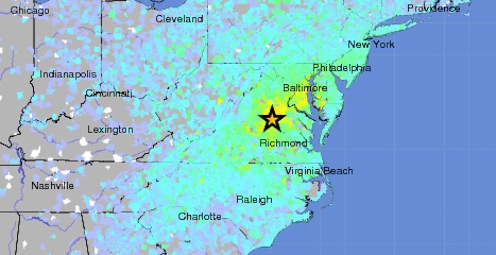
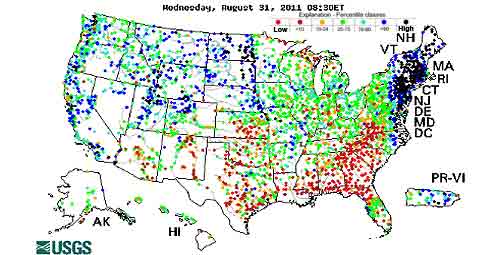
It was one of the largest recorded earthquakes to occur in the east over the last century. Find out what scientists have learned in the past year. Read more
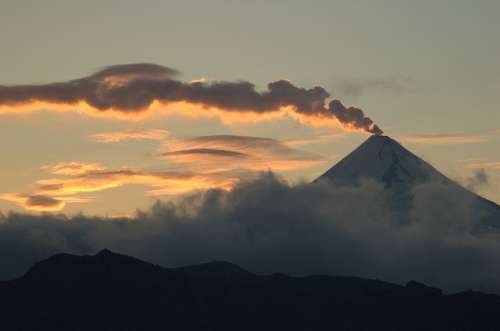
USGS scientists improve systems to monitor and forecast volcanic activity and track volcanic ash to help communities prepare. Read more
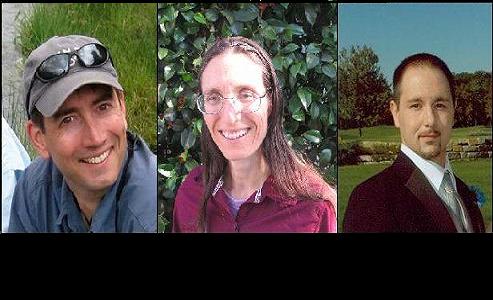
These 3 young scientists have forged ahead with innovative research at the frontiers of science. Learn more
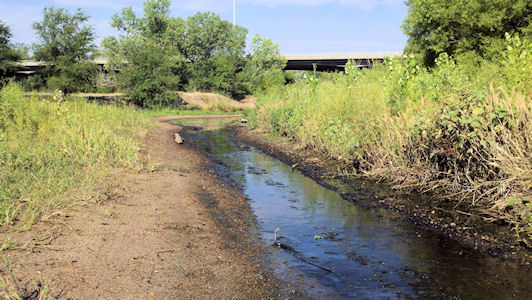
The majority of the nation is facing dry conditions; in most areas drought conditions are expected to persist or intensify. Read more
The new “Did You See It?” website collects citizen observations of landslides. Read more
Please comment on the USGS’ draft science strategies! Read more
Citizen volunteers, portable instruments, and real-time maps help improve gathering of and access to earthquake data.Read more
The USGS and partners are designing an earthquake early warning system for California to help save lives and property.
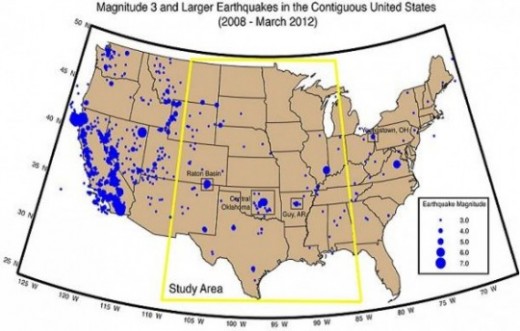
Science or Soundbite? Is the recent increase in midcontinent earthquakes natural or man-made? Find out here.
Timing is everything! Consider helping track changes in spring’s arrival
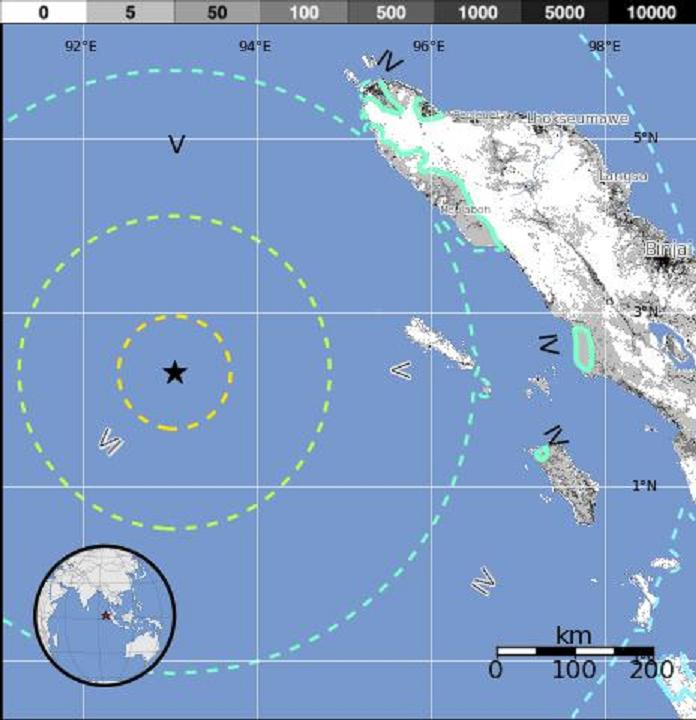
A magnitude-8.6 earthquake struck off the west coast of northern Sumatra Wednesday, April 11, 2012, at 8:38 a.m., UTC at the epicenter.
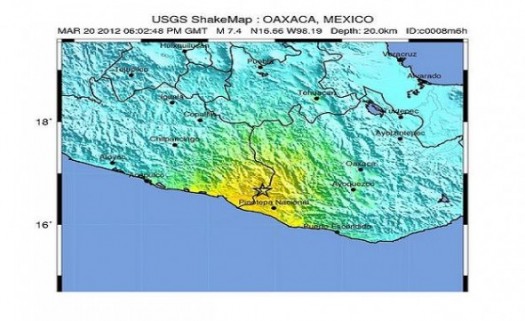
A magnitude-7.4 earthquake struck in the Mexican state of Oaxaca Tuesday, March 20, 2012, at 12:02 p.m., local time at the epicenter.
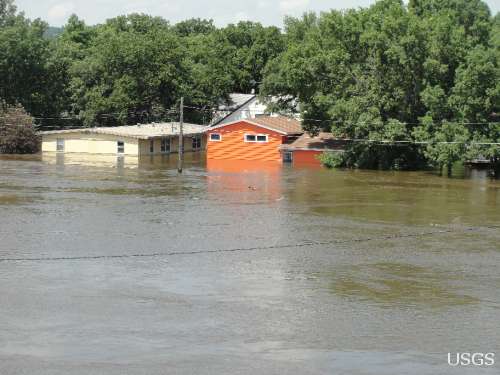
Flood Safety Awareness Week is March. 12-16. What can you do to prepare?
National Groundwater Awareness Week is Mar. 11-17, 2012. See how USGS science is connecting groundwater and surface water.
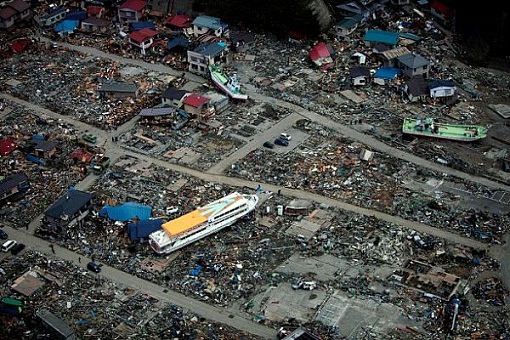
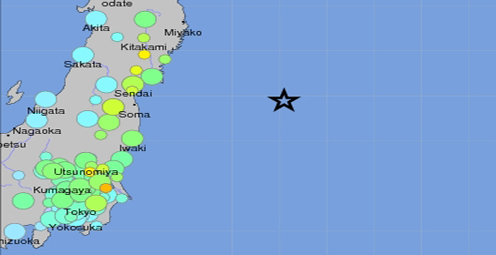
Since Japan’s March 11, 2011, Tohoku earthquake and subsequent tsunami, scientists at the USGS have learned much to help better prepare for a large earthquake in the United States.

Five USGS employees honored with Distinguished Service Awards for their service to the nation
The proposed USGS budget reflects research priorities to respond to nationally relevant issues, including water quantity and quality, ecosystem restoration, hydraulic fracturing, natural disasters such as floods and earthquakes, and support for the National Ocean Policy, and has a large R&D component.
Exploding lakes in Cameroon, Africa, have killed people and livestock. Find out how USGS science is helping prevent such an event from occurring again.
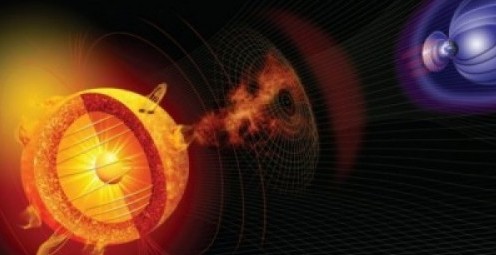
Everyone is familiar with weather systems on earth like rain, wind and snow. But space weather – variable conditions in the space surrounding Earth – has important consequences for our lives inside Earth’s atmosphere.
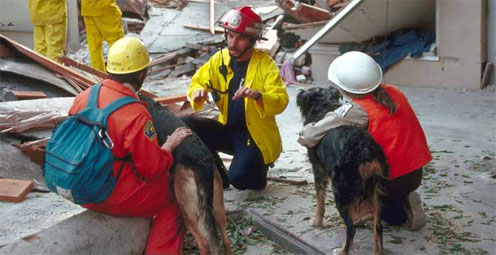
Scientists and communities are working together to make science more useful and communities safer. What one emergency manager has to say.
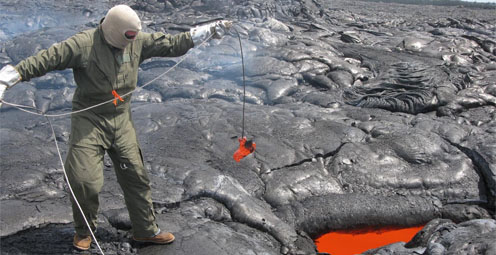
Modern volcano monitoring in the United States began with the founding of the Hawaiian Volcano Observatory in 1912. Living with volcanoes
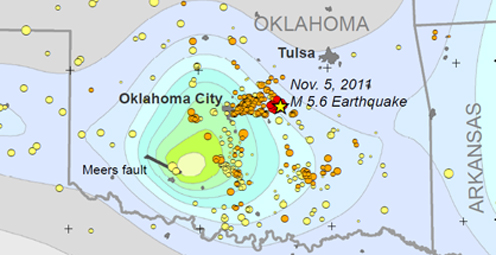
Shaking from Oklahoma's M5.6 main shock, the largest quake in the State's history, was felt from St. Louis to Lubbock. Number of quakes increasing in Oklahoma
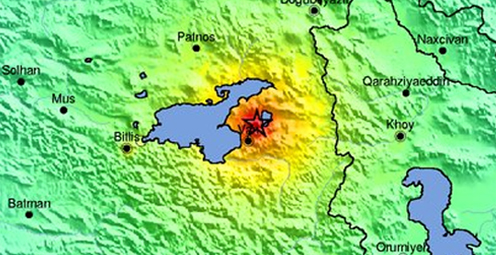
A magnitude-7.2 earthquake struck eastern Turkey on Sunday, October 23, 2011. History of strong earthquakes
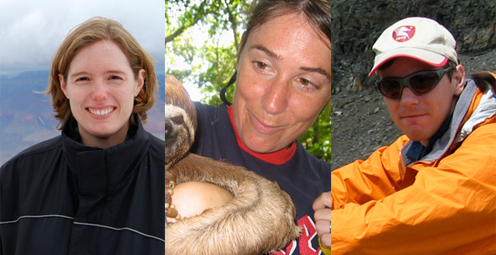
It's only the beginning of their careers, but these 3 young scientists have forged ahead with innovative research at the frontiers of science. How they've transformed their fields
Oct. 9-15, 2011, is Earth Science Week, themed "Our-Ever Changing Earth," and Oct. 12, 2011, is International Day for Natural Disaster Reduction. Answers to questions posed by a changing world
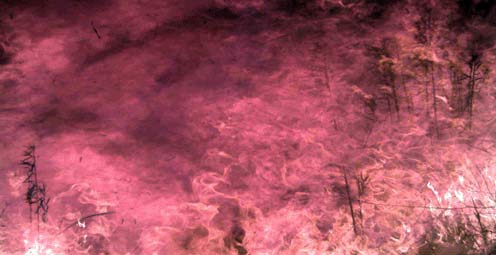
Fire managers and the public can access online maps of current wildfire locations, thanks to a Web-based mapping application provided by the USGS and its partners.
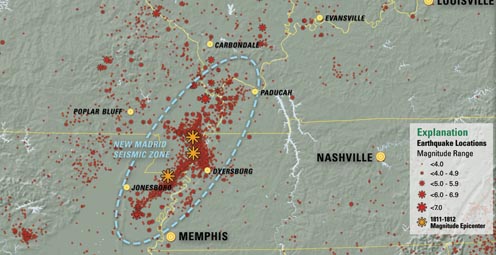
On Feb. 7, 1812, at about 3 a.m., a third, and probably most widely felt of three major earthquakes, occurred in the central Mississippi River Valley. Similar risk today.
Rivers and streams are reaching record levels as a result of Hurricane Irene’s rainfall, with more than 80 USGS streamgages measuring record peaks.
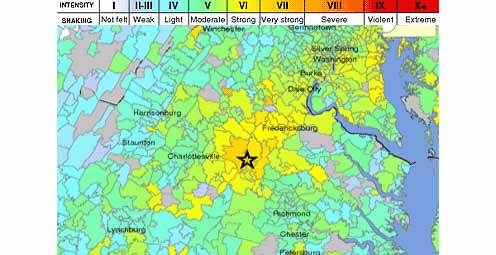
Tuesday, August 23, 2011 at 01:51 PM a 5.8 Earthquake occurred 38 miles outside of Richmond, VA.
A new geologic map of Lassen Volcanic National Park and vicinity has been created. The map area includes the entire Lassen Volcanic Center, parts of three older volcanic centers, and the products of regional volcanism.
To better understand and reduce tsunami hazards, USGS scientists examined sediment deposited by the tsunami in and around Sendai, Japan, as part of an international tsunami survey team organized by Japanese scientific cooperators.
USGS crews continue to measure streamflow and collect water quality and sediment samples in the Ohio and Mississippi River basins using state-of-art instruments.
Many communities in South Dakota, North Dakota, Montana, Colorado, Wyoming and Iowa are dealing with record floodwaters and bracing for more flooding in the upcoming weeks.
Fire managers and the public can access online maps of current wildfire locations, thanks to a web-based mapping application provided by the USGS and its partners.
New Zealand has experienced another damaging earthquake close to the city of Christchurch, which is still recovering from the magnitude-6.1 earthquake that struck in February. This latest quake has resulted in additional damage to buildings and infrastructure.
The USGS-NASA Landsat 5 satellite captured this image of 39-mile track of destruction caused by a massive tornado on June 1 near Sturbridge, MA.
As hurricane season starts, researchers are modeling potential changes to coastal environments to identify communities vulnerable to extreme erosion during storms. Data collected before and after storm landfall are used to verify past forecasts and improve future predictions.
The effects of the March 11 magnitude 9.0 earthquake and resulting tsunami on Japan are being monitored using Landsat satellite data from the USGS.

The most recent earthquake in Japan affected water levels in groundwater wells all over the country. Water level fluctuations were recorded as far away as Illinois, Virginia, Missouri and Florida.

Volcanic activity continues in the Pu`u `O`o crater on Kilauea Volcano's east rift zone and in the Halema`uma`u Crater vent at Kilauea’s summit. Visit the USGS Hawaii Volcanoes Observatory site to get detailed Kilauea and Mauna Loa activity updates, recent volcano photos, recent earthquakes, and more.
Scientists unveil a catastrophic winter storm scenario that could possibly overwhelm California's flood protection system, and significantly disrupt Statewide social and economic systems.
Heavy rainfall could potentially destabilize hillsides. The USGS Landslide Hazards Web site has what you need to know if you live in an area prone to landslides.
The USGS and the National Weather Service have developed a new flood inundation map tool that enables management officials and residents to see where the potential threat of flooding is the highest along the Flint River near Albany, Georgia.

Volcanic eruptions have always been a part of human history; the American experience is no exception. On November 3rd, USGS’s Dr. John Eichelberger discusses new USGS programs which establish monitoring networks on all hazardous US volcanoes, to reduce the effects of volcanic hazards on communities.
Kilauea is Hawaii's youngest volcano and one of the world's most active. Get daily updates on ongoing eruptions from Kilauea's summit and east rift zone.
Looking for information on natural resources, natural hazards, geospatial data, and more? The USGS Education site provides great resources, including lessons, data, maps, and more, to support teaching, learning, K-12 education, and university-level inquiry and research.
The USGS PAGER system (Prompt Assessment of Global Earthquakes for Response) will now include estimated economic loss and casualty information. This system is used by emergency responders, government and aid officials, and the public to understand the scope of the disaster to develop the best response.
Flash flooding is one of the major causes of natural hazard-related deaths in the United States and is hard to predict, but data collected by the USGS is crucial to formulating better predictive models.
The USGS Science Strategy is a comprehensive report to critically examine the USGS's major science goals and priorities for the coming decade. The USGS is moving forward with these strategic science directions in response to the challenges that our Nation's future faces and for the stewards of our Federal lands.

In response to Hurricane Isaac, USGS has deployed several hundred storm surge sensors to collect information about the effects of Isaac on the Gulf Coast.

Join us on September 5th in Reston, VA for a free public lecture on the 2011 Virginia earthquake!

Join us on August 1 to learn more about the anatomy of flooding: What are the different causes of these extreme events, and how is USGS science helping prepare residents for future foods.

Join us on June 6 for a centennial look at the greatest volcanic eruption of the 20th century at our June Public Lecture!

In recognition of World Forestry Day, let’s take a glimpse at USGS science to understand the fate of forests from climate change.

The Volcano Hazards Program announces the establishment of the USGS California Volcano Observatory (CalVO), which expands and replaces the former Long Valley Observatory.

The U.S. Geological Survey had a very busy 2011 — below are a few of our highlights from last year.

On Nov. 3, USGS scientists Patrick Barnard and William Ellsworth will present a public lecture in Menlo Park, CA, providing Bay Area residents information about USGS research in the San Francisco Bay Area, including recent discoveries beneath San Francisco Bay and ongoing studies to better understand earthquake probabilities and the potential hazards associated with strong ground shaking.

Join USGS scientists on November 2nd to discuss the seismology of the M5.8 Virginia earthquake, its effects, and its context in the geology of Virginia.

![]() U.S. Department of the Interior |
U.S. Geological Survey
U.S. Department of the Interior |
U.S. Geological Survey
URL: www.usgs.gov/blogs/features/usgs_top_story/sandy/
Page Contact Information: Ask USGS
Page Last Modified: September 14, 2011


