News Release: GDP by Metropolitan Area, Advance 2010, and Revised 2007–2009
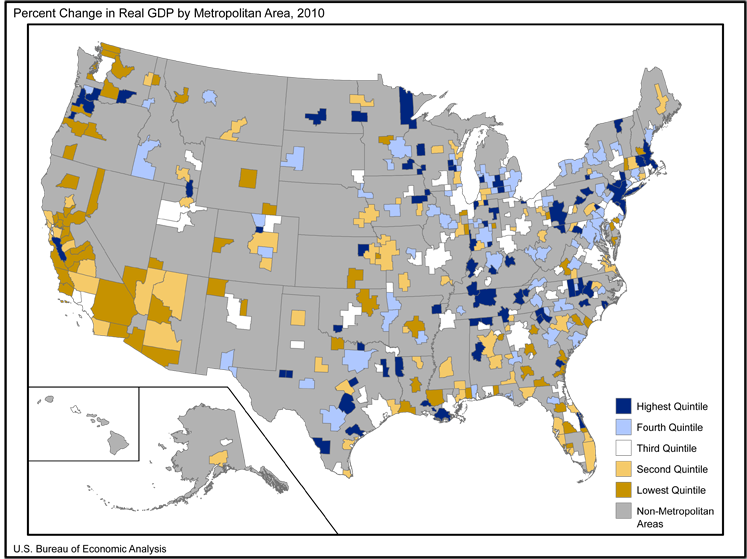
ECONOMIC GROWTH WIDESPREAD ACROSS METROPOLITAN AREAS IN 2010
Real U.S. GDP by metropolitan area increased 2.5 percent in 2010 after declining 2.5 percent in 2009, according to new statistics released today by the U.S. Bureau of Economic Analysis.1 The economic growth was widespread as real GDP increased in 304 of 366 (83 percent) metropolitan areas, led by national growth in durable-goods manufacturing, trade, and financial activities.
Of the ten largest metropolitan areas, the three with the fastest real GDP growth in 2010 were Boston-Cambridge-Quincy, MA-NH (4.8 percent), New York-Northern New Jersey-Long Island, NY-NJ-PA (4.7 percent), and Washington-Arlington-Alexandria, DC-VA-MD-WV (3.6 percent).2 The ten largest metropolitan areas, accounting for 38 percent of U.S. metropolitan area GDP, averaged 2.5 percent growth in 2010 after falling 2.2 percent in 2009.
Durable-goods manufacturing led the resurgence in U.S. real GDP by metropolitan area in 2010. In Durham-Chapel Hill, NC and Palm Bay-Melbourne-Titusville, FL, the industry contributed more than 3.0 percentage points to each area's overall real GDP growth of 6.6 percent and 4.7 percent, respectively.
Strong contributions from durable-goods manufacturing fueled growth in many small metropolitan areas where production of these goods constitutes a large portion of the area's economy.3 This is especially true in the Great Lakes region where durable-goods manufacturing contributed 11.4 percentage points to growth in Elkhart-Goshen, IN and more than 6.0 percentage points to growth in Columbus, IN and Kokomo, IN. Elkhart-Goshen, IN and Columbus, IN were two of the fastest growing metropolitan areas in 2010, with overall real GDP growth of 13.0 percent and 10.1 percent, respectively.
In 2010, growth in trade (wholesale and retail) positively affected many metropolitan areas. Metropolitan areas in the Plains and Mideast regions were affected most—growth in trade continued in Elmira, NY; Williamsport, PA; Lebanon, PA; and Mankato-North Mankato, MN. Growth in trade was strong in Florence-Muscle Shoals, AL; Cape Girardeau-Jackson, MO-IL; and in Midland, TX, where the trade sector turned sharply upward in 2010. In Elmira, NY and Florence-Muscle Shoals, AL, trade added more than two percentage points to real GDP growth in 2010.
The effects of the growth in financial activities were more widespread than other industries in 2010. In Houma-Bayou Cane-Thibodaux, LA; Des Moines-West Des Moines, IA; Hartford-West Hartford-East Hartford, CT; and New York-Northern New Jersey-Long Island, NY-NJ-PA financial activities contributed more than two percentage points to real GDP growth. All of these metropolitan areas grew faster than the national average.
In contrast to most industries, construction continued to detract from growth in 2010. In Las Vegas-Paradise, NV and Steubenville-Weirton, OH-WV, real GDP contracted due to strong concentrations in the construction industry. In Las Vegas-Paradise, NV, real GDP in the construction industry continued to decline by more than twenty percent and sank below its 2001 level.
Tables 1-3 [XLS] show these results in more detail; complete detail is available on BEA's Web site at www.bea.gov.
Advance Statistics of GDP by Metropolitan Area for 2010 by NAICS Sector
The advance statistics of GDP by metropolitan area for 2010 are based on a more limited set of source data and an abbreviated estimation methodology compared with the standard set of data and the estimation methodology used to prepare the revised statistics for 2007—2009. The advance GDP-by-metropolitan-area statistics are based primarily on preliminary earnings-by-industry data from BEA's regional economic accounts, released August 9, 2011.
More information on the methodology used to produce the advance 2010 statistics, on the revised GDP-by-metropolitan-area statistics for 2007—2009, and on revisions to the GDP-by-metropolitan-area statistics will appear in an article in the October 2011 issue of the Survey of Current Business, BEA's monthly journal.
Explanatory Notes
Definitions. GDP by metropolitan area is the sub-state counterpart of the Nation's gross domestic product (GDP), the Bureau's featured and most comprehensive measure of U.S. economic activity. GDP by metropolitan area is derived as the sum of the GDP originating in all the industries in the metropolitan area.
The statistics of real GDP by metropolitan area are prepared in chained (2005) dollars. Real GDP by metropolitan area is an inflation-adjusted measure of each area's gross product that is based on national prices for the goods and services produced within the metropolitan area. The statistics of real GDP by metropolitan area and of quantity indexes with a base year of 2005 were derived by applying national chain-type price indexes to the current-dollar GDP-by-metropolitan-area values for the 61 detailed NAICS-based industries.
The chain-type index formula that is used in the national accounts is then used to calculate the values of total real GDP by metropolitan area and of real GDP by metropolitan area at more aggregated industry levels. Real GDP by metropolitan area may reflect a substantial volume of output that is sold to other areas and countries. To the extent that a metropolitan area's output is produced and sold in national markets at relatively uniform prices (or sold locally at national prices), real GDP by metropolitan area captures the differences across metropolitan areas that reflect the relative differences in the mix of goods and services that the areas produce. However, real GDP by metropolitan area does not capture geographic differences in the prices of goods and services that are produced and sold locally.
Relation of GDP by metropolitan area real growth rates to national GDP. The U.S. metropolitan area growth rates of real GDP may differ from national real GDP growth rates released in the July 2011 annual revision of the national income and product accounts (NIPAs). In addition, the U.S. metropolitan area real GDP growth may differ from the U.S. GDP by state growth released June 7, 2011 due to the exclusion of non-metropolitan areas. Differences with the national growth in real GDP are primarily due to the direct linkage and consistency of GDP-by-metropolitan-area statistics with the most recently released statistics of GDP by state and the Annual Industry Accounts’ GDP by industry. The GDP-by-industry statistics released April 26, 2011 and the GDP-by-state statistics released June 7, 2011 are based upon the annual revision of the NIPAs released in July 2010, and have not yet incorporated revisions to national GDP released in July 2011.
Metropolitan (statistical) areas. The metropolitan (statistical) areas used by BEA for its entire series of GDP statistics are the county-based definitions developed by the Office of Management and Budget (OMB) for federal statistical purposes and last updated in December 2009. OMB's general concept of a metropolitan area is that of a geographic area consisting of a large population nucleus together with adjacent communities having a high degree of economic and social integration with the nucleus.
The statistics of GDP by metropolitan area in current and real (chained) dollars are available from the Regional Economic Accounts page of the BEA Web site at http://www.bea.gov/regional/index.htm.
BEA's national, international, regional, and industry statistics; the Survey of Current Business; and BEA news releases are available without charge on BEA's Web site at www.bea.gov. By visiting the site, you can also subscribe to receive free e-mail summaries of BEA releases and announcements.
Footnotes
1. The growth rates may differ from the national rates of GDP growth. See the "Explanatory Notes" for a detailed description.
2. The ten largest metropolitan areas, as measured by 2010 real GDP, are: New York-Northern New Jersey-Long Island, NY-NJ-PA; Los Angeles-Long Beach-Santa Ana, CA; Chicago-Joliet-Naperville, IL-IN-WI; Washington-Arlington-Alexandria, DC-VA-MD-WV; Houston-Sugar Land-Baytown, TX; Dallas-Fort Worth-Arlington, TX; Philadelphia-Camden-Wilmington, PA-NJ-DE-MD; San Francisco-Oakland-Fremont, CA; Boston-Cambridge-Quincy, MA-NH; and Atlanta-Sandy Springs-Marietta, GA.
3. Small metropolitan areas are those with real GDP of less than $10 billion.