| Advanced Dvorak Technique - Objective Tropical Storm Classifier |
The ADT provides an automated, objectively-derived estimate of tropical storm location and intensity that can be used as an independent piece of information in the generation of a consensus "best" storm classification estimate. In addition to the IR satellite imagery, ADT uses the latest official track forecast bulletins from the Regional Specialized Meteorological Centers (RSMCs) and the Joint Typhoon Warning Center (JTWC). The product graphic shows the most recent location and intensity analysis and the text "list" files show the history of ADT location and intensity analyses while bulletins are available. Product Link |
|
|
||
| GOES, Meteosat, MTSAT-1R | Resolution: 4 Km | Frequency: 30 minutes |
| Ensemble Tropical Rainfall Potential (eTRaP) | The eTRaP is a simple ensemble whose members are the 6-hourly totals from the single-orbit TRaPs. The eTRaP provides deterministic and probabilistic forecasts for each of four 6h time periods (e.g., 00-06h, 06-12h, 12-18h, 18-24h) as well as the 24 hour cumulative time period. Each single orbit TRaP is derived from microwave rainfall rates and the official forecast from the Regional Specialized Meteorological Center (RSMC) and, in the Southern and Eastern Hemispheres, from the Joint Typhoon Warning Center (JTWC) as well. Currently rain rates from AMSU, SSMIS, and TRMM are used. An eTRaP will be produced, centered on the synoptic hours (e.g., 00Z, 06Z, 12Z, 18Z), from single-orbit TRaP segments with start times up to 3 hours after the synoptic hour. Product Link |
|
|
||
| POES | Resolution: 4 Km | Frequency: 6 Hours |
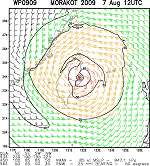
| Multi-Platform Tropical Cyclone Surface Winds Analysis (MTC-SWA) | The main MTCSWA product is the estimation of the surface wind field around active tropical cyclones. The product domain is global and the active storms are determined by areas of interest (invests) and storms that have reached an intensity which triggers warnings in that basin. This information comes from several operational tropical cyclone warning centers. For this product the Joint Typhoon Warning Center, Honolulu, HI provides locations/intensities of active systems in the Southern Hemisphere, Indian Ocean, and western North Pacific, the NCEP Central Pacific Hurricane Center, Honolulu, HI provides locations/intensities for the North Central Pacific, and the NCEP Tropical Prediction Center in Miami, Florida provides location and intensities in the Eastern North Pacific and North Atlantic Basins. Product Link |
|
|
||
| GOES, POES, Meteosat, MTSAT-1R, Metop, MODIS | Resolution: 5 Km | Frequency: 6 Hours |
| Tropical Bulletins | Text bulletins describing the position and intensity estimates for tropical disturbances and tropical cyclones in the Eastern and Southern Hemispheres. Product Link |
|
|
||
| GOES, POES, Meteosat, MTSAT-1R | Resolution: Varies | Frequency: 6 Hours |
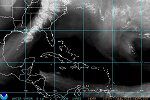
| Tropical Cyclone Formation Probability Product | Geostationary satellite data and National Centers for Environmental Prediction (NCEP) global analyses are used as input to an algorithm developed by the Cooperative Institute for Research in the Atmosphere (CIRA) to estimate the probability of tropical cyclone formation within the next 24 hours in 5 by 5 degree latitude/longitude areas. Product Link |
|
|
||
| GOES, MTSAT-1R | Resolution: 5x5 Degrees | Frequency: 6 Hours |
| Tropical Storm Position and Intensity | Subjective position and intensity estimates of tropical disturbances and tropical cyclones across the globe using the internationally recognized Dvorak technique. Product Link |
|
|
||
| GOES, POES, Meteosat, MTSAT-1R | Resolution: N/A | Frequency: 6 Hours |
| Atlantic Ocean and Gulf of Mexico | Visible, Water Vapor, Shortwave Infrared, and Infrared (Channel 4) imagery sectors offering different views of the Atlantic Ocean basin. Multiple enhancement curves are also provided. Product Links: (Overview) |
|
|
||
| GOES | Resolution: 4-16 Km | Frequency: 30 Minutes |
| Meteosat | Resolution: 8-12 Km | Frequency: 6 Hours |
| Geostationary Satellite Server - Hurricane Sectors | Selected GOES hurricane imagery providing Infrared, Visible and Water Vapor imagery. Coverage sectors include Eastern Pacific, Gulf of Mexico and Western Atlantic, Atlantic, Gulf of Mexico and the Eastern Seaboard. Product Link |
|
|
||
| GOES | Resolution: 4-12 Km | Frequency: Varies |
| Pacific Ocean | Visible, Water Vapor, Shortwave Infrared, and Infrared (Channel 4) imagery sectors offering different views of the Pacific Ocean basin. Multiple enhancement curves are also provided. Product Links: (Overview) |
|
|
||
| GOES and MTSAT-1R | Resolution: 3-16 Km | Frequency: 30 - 60 Minutes |
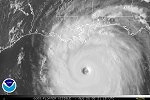
| Tropical Floaters | Still satellite images and loops of active tropical cyclones. The term "Floater" is used for these images because they are frequently recentered over the active tropical systems by on-duty tropical analysts. This allows users to follow the same storm using the same URL regardless of where the system is located. Product Link |
|
|
||
| GOES and MTSAT-1R | Resolution: 1-5 Km | Frequency: Event Driven |