The following data, generated by Dr. James Deatherage, are related to an NIGMS Feedback Loop post from February 15, 2012, on Fiscal Year 2011 R01 Funding Outcomes and Estimates for Fiscal Year 2012.
View larger image
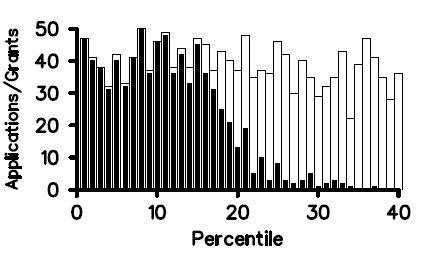
Figure 1. Competing R01 applications reviewed (open rectangles) and funded (solid bars) in Fiscal Year 2011.
View larger image
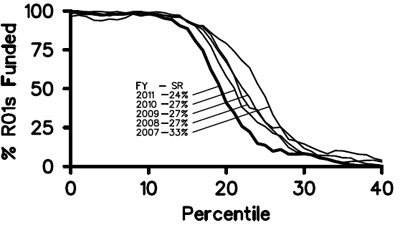
Figure 2. NIGMS competing R01 funding curves for Fiscal Years 2007-2011. For Fiscal Year 2011, the success rate for R01 applications was 24%, and the midpoint of the funding curve was at approximately the 19th percentile.
View larger image
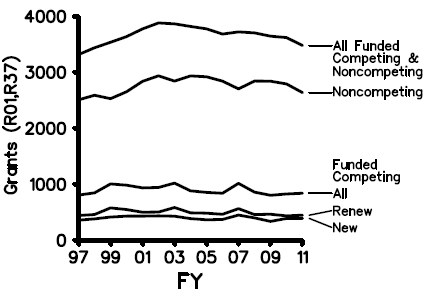
Figure 3. Number of R01 and R37 grants (competing and noncompeting) funded in Fiscal Years 1997-2011.
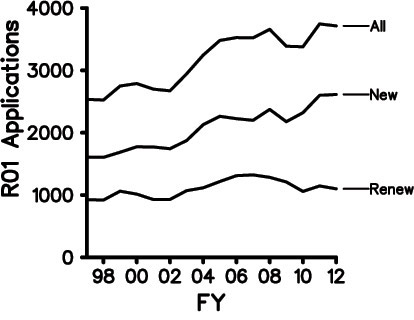
Figure 4. Number of competing R01 applications (including revisions) received during Fiscal Years 1998-2012.
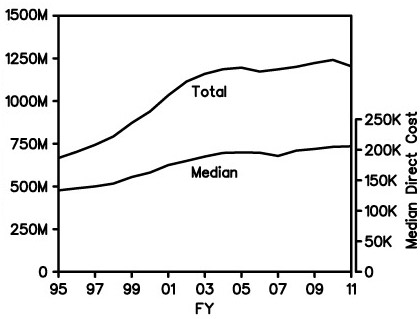
Figure 5. The upper curve shows the overall NIGMS expenditures on R01 and R37 grants (competing and noncompeting, including supplements) in Fiscal Years 1995-2011. The lower curve (right vertical axis) shows the median direct costs of NIGMS R01 grants. Results are in actual dollars with no correction for inflation.