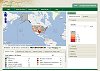
Current U.S. Drought Monitor
|
The data cutoff for Drought Monitor maps is Tuesday at 7 a.m. Eastern Standard Time. The maps, which are based on analysis of the data, are released each Thursday at 8:30 a.m. Eastern Time. NOTE: To view regional drought conditions, click on map below. State maps can be accessed from regional maps. |

The U.S. Drought Monitor is produced in partnership between the National Drought Mitigation Center at the University of Nebraska-Lincoln, the United States Department of Agriculture, and the National Oceanic and Atmospheric Administration.
UPDATE: The links have been moved into the menu bars below.
NDMC's Drought Impact Reporter |
6-week animation |
12-week animation |
Custom DM animation |
short-term drought indicator blends |
long-term drought indicator blends |
 |
 |
 |
 |
 |
 |
For local details and impacts, please contact your State Climatologist or Regional Climate Center.
| The discussion in the Looking Ahead section is simply a description of what the official national guidance from the National Weather Service (NWS) National Centers for Environmental Prediction is depicting for current areas of dryness and drought. The NWS forecast products utilized include the HPC 5-day QPF and 5-day Mean Temperature progs, the 6-10 Day Outlooks of Temperature and Precipitation Probability, and the 8-14 Day Outlooks of Temperature and Precipitation Probability, valid as of late Wednesday afternoon of the USDM release week. The NWS forecast web page used for this section is: http://www.cpc.ncep.noaa.gov/products/forecasts/. This US Drought Monitor week was dominated by two weather systems. The first system provided widespread moisture through the Southeast and mid-Atlantic before dumping large amounts of snow across New England. Unofficial totals include 33.5 inches in Glastonbury, CT, 24.9 inches in Boston, MA, 31.9 inches in Portland, ME, and 20.5 inches in Providence, RI. High winds also accompanied this storm with wind gusts up to 83MPH near the Atlantic coast in Massachusetts. In the second storm event of the week, severe thunderstorms rolled through the South and Gulf States producing an estimated 19 tornadoes and numerous high wind and hail events, according to the Storm Prediction Center. The Southeast: The Southeast has seen rain fairly consistently throughout this US Drought Monitor week. Multi-day rains across Alabama and Georgia have put a significant dent in the drought conditions there. In Georgia, Exceptional Drought (D4) was eradicated and areas of Extreme (D3), Severe (D2), and Moderate Drought (D1) and Abnormal Dryness (D0) were all reduced there and in Alabama. One significant aspect of the storms this week was severe weather on February 10. This event brought and estimated 19 tornadoes to the area as well as a large number of wind and hail events. In North Carolina, areas of Moderate Drought (D1) and Abnormal Dryness (D0) were reduced due to the precipitation. Conversely, South Florida continues to receive below normal precipitation and saw a small expansion of Moderate Drought (D1). The Northeast and Mid-Atlantic: The Northeast was hit by a major winter storm this week. As mentioned above, widespread two foot and greater snowfall was experienced throughout the region. Hundreds of flights were cancelled and thousands were delayed due to the snow. Numerous roads were closed throughout the area. Hundreds of thousands of homes lost power during the storm and one death has been attributed to it. While snow fell across the region, it largely missed the areas of Abnormal Dryness (D0). These areas remained relatively constant with a slight repositioning in New York and a minor improvement in New Hampshire. Conditions in the Mid-Atlantic remained unchanged. The South and Southern Plains: Improvement was made this week in Extreme Drought (D3) in eastern Oklahoma and Kansas. There was also improvement in Severe (D2) and Moderate Drought (D1) and Abnormal Dryness (D0) across eastern Texas while areas of southern Texas and the Panhandle saw small expansion of Exceptional (D4), Extreme (D3), and Severe Drought (D2). The Central and Northern Plains and Midwest: Conditions continued to improve in the Upper Midwest and Northern Plains. Widespread snowfall in the eastern Dakotas and across Minnesota led to improvements in Extreme (D3) and Severe Drought (D2) conditions in that area. Additionally, southwest Missouri saw some improvement in Severe Drought (D2) conditions. The West: Improving snowpack conditions led to improvements in Extreme (D3) and Severe Drought (D2) conditions in the Four Corners area. Improvements were also experienced in Extreme (D3), Severe (D2), and Moderate Drought (D1) and Abnormal Dryness (D0) from southern Montana, through northwest Wyoming and southern Idaho, and into southeast Oregon. In California, Severe (D2) and Moderate Drought (D1) conditions expanded north of Los Angeles. Hawaii, Alaska and Puerto Rico: Drought conditions remained unchanged in these areas this week. Looking Ahead: During the February 14-18, 2013 time period, there is a suppressed probability of precipitation across nearly the entire US, with the exception of isolated locations along the East Coast focused mainly in northern New England and in south Florida. Temperatures are variable throughout this time period. Initially, above-normal temperatures are expected from the Ohio Valley through the Southern Plains and along the West Coast. These temperature are expected to migrate eastward and by the end of this period, the above normal temperatures will have moved from the West Coast, across the Rockies, and into the Great Plains once again. For the ensuing 5 days (February 19-23, 2013), the odds favor below-normal temperatures throughout the entire West as well as across Alaska. Above-normal temperatures are favored in the South and in the lower Mississippi River Valley. Above normal-precipitation is likely from roughly the east side of the Rocky Mountains to the East Coast. The far Southwest and the West Coast are likely to see below-normal precipitation. Alaska is generally expected to see above normal precipitation with the exception of the far northwest part of the state and the Anchorage area. |
| Dryness Categories |
| D0 ... Abnormally Dry ... used for areas showing dryness but not yet in drought, or for areas recovering from drought.
Updated February 13, 2013 |


)