Pollution Prevention (P2) and TRI
The Waste Management Hierarchy
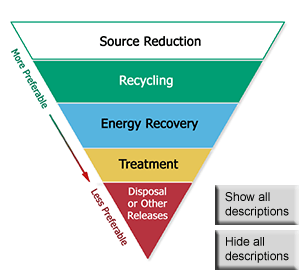
The PPA calls for pollution to be prevented or reduced at the source whenever feasible and released to the environment only as a last resort. Click the sections in the triangle to learn more.
Source Reduction includes activities that eliminate or reduce the generation of chemical waste.Recycling includes the recovery of a toxic chemical in waste for reuse.Energy Recovery includes the combustion of toxic chemicals in waste to generate heat or electricity.Treatment includes the destruction of a toxic chemical in waste.Disposal or Other Releases includes toxic chemical quantities entering the environment.
For more information, please see Interpretations of Waste Management Activities (PDF) (19 pp, 37K) .
Under the Pollution Prevention Act of 1990 (PPA) , TRI collects information to track industry progress in reducing waste generation and moving towards safer waste management alternatives.
Launch P2 Search Tool
When providing this information, many facilities choose to describe the measures they have taken to prevent pollution and reduce the amount of toxic chemicals entering the environment. As a result, TRI serves as a tool for identifying effective environmental practices and highlighting pollution prevention successes.
Access TRI's P2 Data
Use the TRI Search
Use the P2 Search
Coming Soon - Use TRI.NET for more complex P2 queries
Other TRI P2 Resources
You will need Adobe Reader to view the (PDF) files on this page. See EPA's PDF webpage to learn more.
Source Reduction Activities Reported to TRI
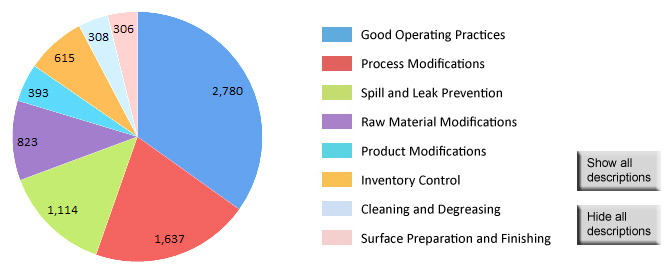
For 2010, a total of 2,302 facilities (11% of all TRI facilities) reported initiating 7,976 source reduction activities. Good operating practices, process modifications, and spill and leak prevention were the activities reported most frequently. To see examples of source reduction activities reported by TRI facilities, click on the pieces of the pie chart.
Number of Activities Reported, 2010
Good Operating Practices
Examples:
A bolt nut, screw, rivet, and washer manufacturer implemented source reduction activities during prior years and continues during 2010, including: regular equipment inspection and preventative maintenance, process solution analysis, solution change-overs based on actual usage and depletion (instead of time intervals), and employee training.
An organic chemical manufacturer implemented a program to review all production recipes with the intention of decreasing all production "cooking" time to maximize production and efficiency. Through this review the company reduced holding and feeding times of their production processes.
Process Modifications
Examples:
A plastics materials and resin manufacturing facility has implemented an in-line toluene recovery system to reuse recovered toluene as a raw material in their processes rather than generating waste.
A paper mill has incorporated a retubed boiler to increase efficiency during production.
An alkalines and chlorine manufacturing facility has reduced the generation of dioxin-containing waste through the modification of their purification equipment.
Spill and Leak Prevention
Examples:
A merchant wholesaler of chemical and allied products integrated simple spill and leak prevention techniques into their process equipment during 2010. They used dedicated process-specific equipment to minimize the need for replacements or cleanings of transfer hoses. The facility also modified their filling equipment with auto shut-off and drip cups to eliminate loss during the filling process. Subsequently, any accumulation in the drip cups automatically deposits into the proceeding container awaiting filling. The company now avoids spills, eliminates unnecessary material loss, and maximizes production.
Raw Material Modifications
Examples:
A facility that manufacturers corn-based products such as sweeteners, corn oil, and starches implemented source reduction activities in 2010. The facility was able to decrease their lead releases by switching to a cleaner type of coal, used to fuel their production processes.
A plastics manufacturer also reported reducing their lead releases by modifying a colorant material used during production to a new lead-free version.
Product Modifications
Examples:
A manufacturer of assembly circuits implemented source reduction activities in 2010, through a continued effort to transition to use lead-free solder in all their products.
A plastics materials and resin manufacturer modified their product mix to reduce the consumption of barium compounds.
An asphalt shingle and coating materials manufacturer modified the composition of their product to reduce the need for a raw material contributing to benzo(g,h,i)perylene emissions. They also started a shingle recycling program with an off-site contractor that will reduce the disposal in landfills.
Inventory Control
Examples:
A paint and coating manufacturer prevented pollution through better inventory control. As their coating products with high concentrations of glycol ethers approach their shelf life, the company re-blends the coating products for customers not requiring the concentrate and characteristics of the original product.
Cleaning and Degreasing
Examples:
A facility primarily engaged in pasteurizing milks, creams, and other dairy products reduced the use of toxic chemicals on-site in 2010 by upgrading their cleaning systems to a new technology that allows for lower chemical usage, treatment, and disposal.
An automotive parts manufacturer reduced the use of toxic chemicals on-site by switching from an aqueous ammonia solution (used to clean the floor) to a purge solvent that neutralizes prior to being discharged to a publicly owned treatment works.
Surface Preparation and Finishing
Examples:
In 2010, a manufacturing facility of motor vehicle seats and interior trim was able to reduce the amount of a toxic-chemical-containing spray needed for surface preparation and finishing of their products. By improving production processes, this facility reduced their usage of cyclohexane by 43% per unit of product in comparison to the prior year.
A metal and can manufacturing facility reduced the use of over varnish necessary for product preparation and finishing, by modifying application processes and increasing the frequency and quality of equipment inspection and maintenance.
Top of page


