Tracking Global Investment: Who Owns What—and Where

How much does the United States own abroad? And how does that stack up against what foreign investors own in this country? Tracking the ownership and value of trillions of dollars’ worth of financial assets like stocks, bonds, loans, and cash in bank accounts to come up with answers to these very questions is the work of skilled financial sleuths at the U.S. Bureau of Economic Analysis (BEA).021213
We hear a lot about the globalization of commerce and that global interconnectedness is seen vividly on the investment front. BEA’s work helps businesses and government policymakers monitor investors’ appetites for risk and gauge the attractiveness of the United States as a place to invest.

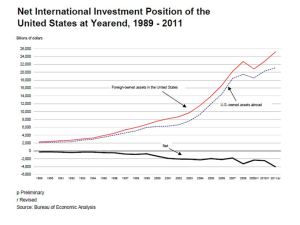
U.S. investors have a strong appetite for the higher returns of foreign stocks versus lower yielding bonds. U.S. investors’ holdings of foreign stocks totaled $4.2 trillion at the end of 2011. In addition, U.S. companies’ and individuals’ ownership stakes in foreign businesses totaled $4.7 trillion. A third large category is money in bank and brokerage accounts valued at $4.3 trillion in bank and brokerage accounts. When other assets are counted, the United States owned a grand total of $21.13 trillion abroad.

Foreign investors, on the other hand, prefer U.S. Treasuries, considered a safe investment. Foreigners’ investments in U.S. Treasuries totaled $5.1 trillion at the end of 2011. (That’s combining the holdings of private investors, foreign central banks, and other government entities.) Foreign companies and individuals, meanwhile, had ownership stakes in U.S. companies valued at $2.9 trillion. Foreigners had $4 trillion worth of assets in U.S. bank and brokerage accounts. Altogether, foreign-owned assets in the United States totaled $25.16 trillion.

Looking across countries, the largest net creditor nations to the United States are China and Japan.

The difference between the total amount of assets Americans own abroad and the total amount of assets foreigners own in the United States is called the net U.S. international investment position.

At the end of 2011, the U.S. net international investment position was $4.03 trillion in the negative. (The United States owned assets in other countries worth $21.13 trillion, while the value of assets foreigners owned in the United States came to $25.16 trillion.) To put that negative $4.03 trillion figure in perspective, it is equal to 5.8 percent of the $69 trillion net worth of U.S. households, businesses, and governments.

In 2010, the net U.S. international investment position was a negative $2.47 trillion, compared with a negative $4.03 trillion in 2011. What happened?

More than half of the negative $1.6 trillion change in the net investment position (from 2010 to 2011) was due to an increase in the prices of foreign holdings of U.S. Treasuries and a decline in the prices of U.S. holdings of foreign stocks. Much of the rest of the increase was in the form of more purchases of U.S. Treasury securities and direct investments by foreign companies. Sometimes, the international investment position is described as the U.S. international debt position, but as the sources of the increase in 2011 suggest, it is in great part reflecting the attractiveness of the United States as a destination for foreign investment.

BEA produces annual reports on the net international investment position, but in just a few months, it will begin providing more timely information on this topic. On March 26, it will begin issuing quarterly reports on the net U.S. international investment position, starting with the fourth quarter of 2012. The new quarterly report (read more here) will offer a more up-to-date picture of the value of U.S. investments abroad compared to the value of foreign investments in the United States.

The investment position accounts complement the international transactions accounts (read more here and here). When used in combination, the two sets of accounts provide a complete statistical picture of the international sector of the U.S. economy.

You can find the latest annual international investment position release here or read more detailed information here.
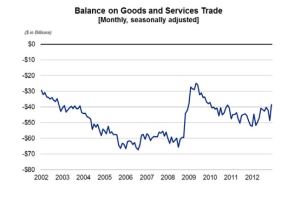
December 2012 Trade Gap is $38.5 Billion

The U.S. monthly international trade deficit decreased in December 2012, according to the U.S. Bureau of Economic Analysis and the U.S. Census Bureau. The deficit decreased from $48.6 billion (revised) in November to $38.5 billion in December, as exports increased and imports decreased. The previously published November deficit was $48.7 billion. The goods deficit decreased $9.4 billion from November to $56.2 billion in December, and the services surplus increased $0.7 billion from November to $17.7 billion in December.trade_020813

Exports
Exports of goods and services increased $3.9 billion in December to $186.4 billion, mostly reflecting an increase in exports of goods. Exports of services also increased.
• The increase in exports of goods was more than accounted for by an increase in industrial supplies and materials. Decreases in capital goods, automotive vehicles, parts, and engines, and consumer goods were partly offsetting.
• The increase in exports of services mostly reflected increases in other transportation, which includes freight and port services, other private services, which includes items such as business, professional, and technical services, insurance services, and financial services, passenger fares, and travel.

Imports
Imports of goods and services decreased $6.2 billion in December to $224.9 billion, mostly reflecting a decrease in imports of goods. Imports of services also decreased.
• The decrease in imports of goods mostly reflected decreases in industrial supplies and materials, automotive vehicles, parts and engines, and other goods.
• The decrease in imports of services was more than accounted for by decreases in travel and other transportation. Increases in passenger fares and other private services were partly offsetting.

Goods by geographic area (not seasonally adjusted)
• The goods deficit with China decreased from $29.0 billion in November to $24.5 billion in December. Exports decreased $0.2 billion to $10.4 billion, while imports decreased $4.7 billion to $34.8 billion.
• The goods deficit with the European Union decreased from $12.2 billion in November to $8.7 billion in December. Exports increased $0.2 billion to $21.6 billion, while imports decreased $3.2 billion to $30.3 billion.
• The goods deficit with Mexico decreased from $4.9 billion in November to $3.9 billion in December. Exports decreased $2.4 billion to $16.4 billion, while imports decreased $3.4 billion to $20.3 billion.

To learn more about U.S. international trade in goods and services, read the full report.

Personal Income Rises in December

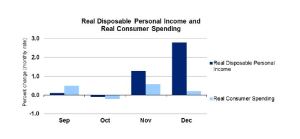
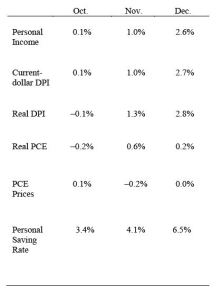
PI_13113_1Personal income increased 2.6 percent in December after increasing 1.0 percent in November. Accelerated bonus payments of $30 billion (at an annual rate) in December and $15 billion in November boosted wages and salaries. Accelerated dividend payments of $291.0 billion in December and $25.8 billion in November, made in anticipation of tax law changes, boosted personal dividend income.

Current-dollar disposable personal income (DPI), after-tax income, increased 2.7 percent in December after increasing 1.0 percent in November.

Real DPI, income adjusted for taxes and inflation, grew 2.8 percent in December after increasing 1.3 percent in November.

Real consumer spending, spending adjusted for price changes, increased 0.2 percent in December after increasing 0.6 percent in November.

PI_13113_2PCE prices remained flat in December after decreasing 0.2 percent in November.

Personal saving rate
Personal saving as a percent of DPI was 6.5 percent in December, the highest rate since May 2009.

To learn more about personal income and outlays, read the full report.

GDP Declines Slightly in Fourth Quarter

Real gross domestic product (GDP) decreased 0.1 percent in the fourth quarter of 2013 after increasing 3.1 percent in the third quarter, according to estimates released today by the Bureau of Economic Analysis. For the full year 2012, real GDP increased 2.2 percent after increasing 1.8 percent in 2011.

Fourth-quarter highlights
The decline in real GDP growth in the fourth quarter reflected the following:
• Inventory investment turned down, mainly because of a decline in inventory investment in manufacturing industries.
• Federal government spending fell significantly, reflecting a downturn in defense spending (for more information, see the technical note).
• Net exports turned down, mainly reflecting a decrease in exports of goods; food, feeds, and beverage items as well as civilian aircraft, engines, and parts fell significantly.
In contrast, business investment turned up, as spending on equipment and software rebounded (mainly computers and related parts as well as transportation equipment). Consumer spending also picked up (mainly financial services as well as autos and parts).

Gross domestic purchases prices
Prices of goods and services purchased by U.S. residents rose 1.3 percent in the fourth quarter, following a 1.4 percent rise in the third quarter. Energy prices slowed, and food prices turned up. Excluding food and energy, prices rose 1.1 percent in the fourth quarter, compared with 1.2 percent in the third quarter.

Annual highlights
The pickup in economic growth for the full year 2012 mainly reflected:
• A slowdown in imports, notably in capital goods (except autos) and consumer goods.
• A rebound in residential housing.
• An upturn in inventory investment.
• A smaller decrease in state and local government spending.

The contributions were partly offset by slowdowns in consumer spending (mainly on services and nondurable goods) and in exports (mainly industrial supplies and materials).

For more:
- here’s the full report.

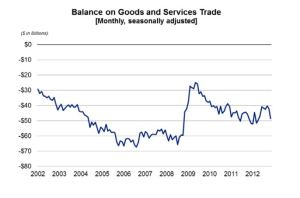
November 2012 Trade Gap is $48.7 Billion

The U.S. monthly international trade deficit increased in November 2012, according to the U.S. Bureau of Economic Analysis and the U.S. Census Bureau. The deficit increased from $42.1 billion (revised) in October to $48.7 billion in November, as imports increased more than exports. The previously published October deficit was $42.2 billion. The goods deficit increased $6.6 billion from October to $65.7 billion in November, and the services surplus was virtually unchanged from October at $17.0 billion in November.trade_nov

Exports
Exports of goods and services increased $1.7 billion in November to $182.6 billion, mostly reflecting an increase in exports of goods. Exports of services also increased.
• The increase in exports of goods was more than accounted for by increases in capital goods, automotive vehicles, parts and engines, and industrial supplies and materials.
• The increase in exports of services was more than accounted for by increases in passenger fares and travel. A decrease in other private services, which includes items such as business, professional, and technical services, insurance services, and financial services, was partly offsetting.

Imports
Imports of goods and services increased $8.4 billion in November to $231.3 billion, mostly reflecting an increase in imports of goods. Imports of services also increased.
• The increase in imports of goods mostly reflected increases in consumer goods, automotive vehicles, parts and engines, and industrial supplies and materials.
• The increase in imports of services reflected an increase in other transportation, which includes freight and port services. Smaller increases in most of the other categories of services imports also contributed.

Goods by geographic area (not seasonally adjusted)
• The goods deficit with China decreased from $29.5 billion in October to $29.0 billion in November. Exports decreased $0.2 billion to $10.6 billion, while imports decreased $0.7 billion to $39.5 billion.
• The goods deficit with Canada increased from $1.7 billion in October to $3.0 billion in November. Exports decreased $1.2 billion to $24.7 billion, while imports increased $0.1 billion to $27.7 billion.
• The goods deficit with Mexico increased from $4.4 billion in October to $4.9 billion in November. Exports decreased $1.6 billion to $18.8 billion, while imports decreased $1.1 billion to $23.7 billion.

To learn more about U.S. international trade in goods and services, read the full report.


Enter your email address to follow this blog and receive notifications of new posts by email.

Join 95 other followers