Glaucoma, Open-angle
Open-angle Glaucoma Defined
In open-angle glaucoma, the fluid passes too slowly through a spongy meshwork. Since the fluid builds up, the pressure inside the eye rises to a level that may damage the optic nerve. When the optic nerve is damaged from increased pressure, open-angle glaucoma-and vision loss may result.
On this page:
2010 U.S. Age-Specific Prevalence Rates for Glaucoma by Age and Race/Ethnicity
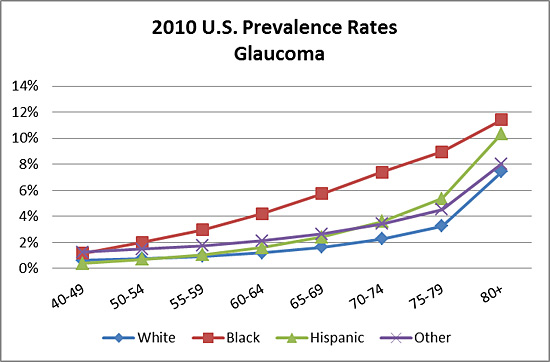
| Age |
White |
Black |
Hispanic |
Other |
All |
| 40-49 |
0.61% |
1.15% |
0.39% |
1.25% |
0.69% |
| 50-54 |
0.75% |
2.01% |
0.71% |
1.47% |
0.94% |
| 55-59 |
0.93% |
2.96% |
1.06% |
1.73% |
1.21% |
| 60-64 |
1.20% |
4.20% |
1.60% |
2.11% |
1.58% |
| 65-69 |
1.62% |
5.73% |
2.40% |
2.65% |
2.11% |
| 70-74 |
2.26% |
7.38% |
3.60% |
3.42% |
2.88% |
| 75-79 |
3.26% |
8.94% |
5.36% |
4.53% |
3.93% |
| 80+ |
7.42% |
11.42% |
10.36% |
8.03% |
7.89% |
| TOTAL |
1.72% |
3.42% |
1.50% |
2.13% |
1.91% |
| Female/Age |
White |
Black |
Hispanic |
Other |
All |
| 40-49 |
0.84% |
1.61% |
0.40% |
1.65% |
0.94% |
| 50-54 |
0.89% |
2.26% |
0.74% |
1.72% |
1.10% |
| 55-59 |
1.00% |
2.85% |
1.13% |
1.88% |
1.29% |
| 60-64 |
1.22% |
3.58% |
1.71% |
2.17% |
1.56% |
| 65-69 |
1.58% |
4.52% |
2.60% |
2.65% |
2.01% |
| 70-74 |
2.20% |
5.69% |
3.92% |
3.40% |
2.74% |
| 75-79 |
3.28% |
7.11% |
5.87% |
4.57% |
3.87% |
| 80+ |
8.51% |
10.57% |
11.49% |
8.76% |
8.84% |
| TOTAL |
2.07% |
3.39% |
1.77% |
2.44% |
2.21% |
| Male/Age |
White |
Black |
Hispanic |
Other |
All |
| 40-49 |
0.38% |
0.65% |
0.37% |
0.80% |
0.44% |
| 50-54 |
0.61% |
1.73% |
0.67% |
1.19% |
0.78% |
| 55-59 |
0.85% |
3.08% |
0.99% |
1.55% |
1.14% |
| 60-64 |
1.19% |
4.96% |
1.47% |
2.03% |
1.60% |
| 65-69 |
1.66% |
7.31% |
2.16% |
2.65% |
2.23% |
| 70-74 |
2.32% |
9.75% |
3.19% |
3.45% |
3.05% |
| 75-79 |
3.23% |
11.86% |
4.66% |
4.49% |
4.02% |
| 80+ |
5.53% |
13.29% |
8.47% |
6.85% |
6.22% |
| TOTAL |
1.34% |
3.46% |
1.21% |
1.76% |
1.57% |

2010 Prevalence Rates of Glaucoma by Race
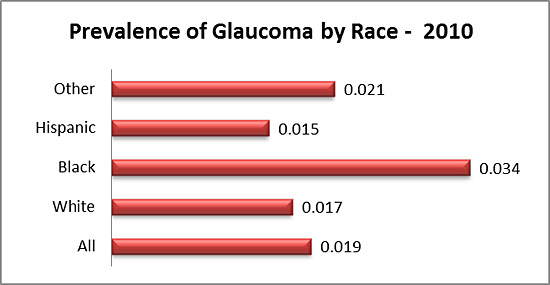
| |
All |
White |
Black |
Hispanic |
Other |
| Prevalence |
0.019 |
0.017 |
0.034 |
0.015 |
0.021 |
2010 U.S. Prevalent Cases of Glaucoma (in thousands) by Age, and Race/Ethnicity
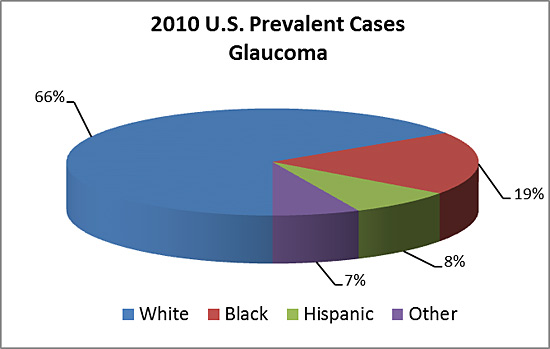
| Age |
White |
Black |
Hispanic |
Other |
All |
| 40-49 |
175 |
61 |
25 |
40 |
301 |
| 50-54 |
119 |
53 |
17 |
21 |
210 |
| 55-59 |
134 |
64 |
20 |
21 |
239 |
| 60-64 |
154 |
70 |
21 |
20 |
265 |
| 65-69 |
157 |
65 |
22 |
18 |
262 |
| 70-74 |
164 |
62 |
25 |
17 |
268 |
| 75-79 |
191 |
54 |
27 |
15 |
287 |
| 80+ |
698 |
90 |
65 |
34 |
887 |
| TOTAL |
1,792 |
519 |
222 |
186 |
2,719 |
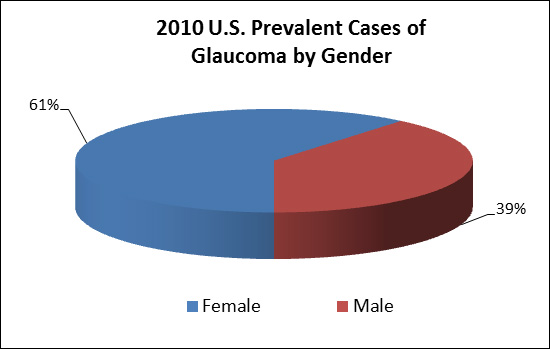
2010 U.S. Prevalent Cases of Glaucoma (in thousands) by Age, Gender, and Race/Ethnicity
| Female/Age |
White |
Black |
Hispanic |
Other |
All |
| 40-49 |
121 |
45 |
13 |
28 |
207 |
| 50-54 |
71 |
32 |
9 |
13 |
125 |
| 55-59 |
74 |
33 |
11 |
12 |
130 |
| 60-64 |
80 |
33 |
12 |
11 |
136 |
| 65-69 |
80 |
29 |
13 |
10 |
132 |
| 70-74 |
86 |
28 |
15 |
9 |
138 |
| 75-79 |
107 |
26 |
17 |
9 |
159 |
| 80+ |
508 |
57 |
45 |
23 |
633 |
| TOTAL |
1,127 |
283 |
135 |
115 |
1,660 |
| Male/Age |
White |
Black |
Hispanic |
Other |
All |
| 40-49 |
54 |
16 |
12 |
12 |
94 |
| 50-54 |
48 |
21 |
8 |
8 |
85 |
| 55-59 |
60 |
31 |
9 |
9 |
109 |
| 60-64 |
74 |
37 |
9 |
9 |
129 |
| 65-69 |
77 |
36 |
9 |
8 |
130 |
| 70-74 |
78 |
34 |
10 |
8 |
130 |
| 75-79 |
84 |
28 |
10 |
6 |
128 |
| 80+ |
190 |
33 |
20 |
11 |
254 |
| TOTAL |
665 |
236 |
87 |
71 |
1,059 |
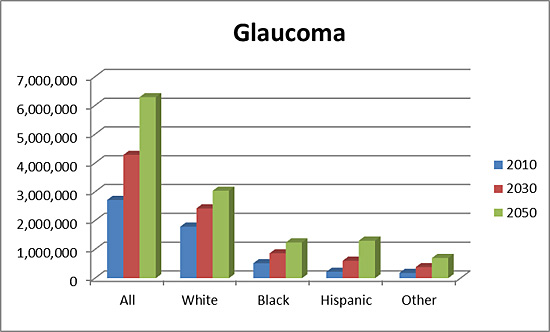
Projections for Glaucoma (2010-2030-2050)
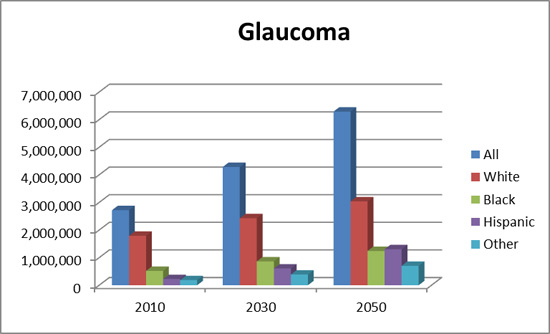
| Year |
All |
White |
Black |
Hispanic |
Other |
| 2010 |
2,719,379 |
1,790,551 |
520,044 |
223,551 |
185,233 |
| 2030 |
4,284,823 |
2,427,339 |
864,732 |
606,122 |
386,629 |
| 2050 |
6,290,760 |
3,039,512 |
1,241,808 |
1,306,113 |
703,326 |
| Total Population |
142,648,393 |
103,846,437 |
15,190,777 |
14,901,369 |
8,709,810 |
Changes of Cases between 2000 and 2010
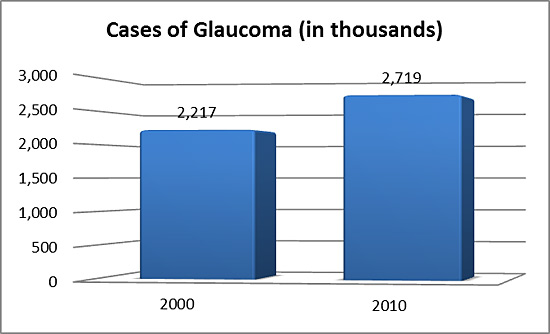
| Year |
Value |
Short Value |
| 2000 |
2,216,785 |
2,217 |
| 2010 |
2,719,379 |
2,719 |
2000 U.S. Prevalent Cases of Glaucoma (in thousands) by Age, and Race/Ethnicity
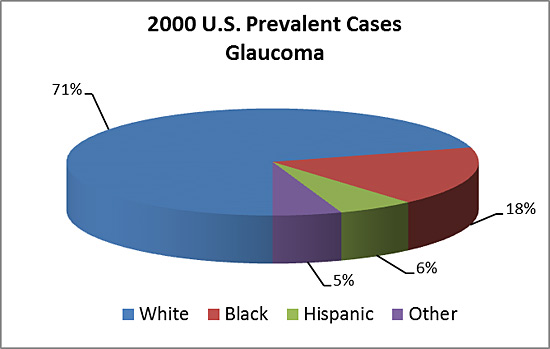
| Age |
White |
Black |
Hispanic |
Other |
All |
| 40-49 |
188 |
55 |
16 |
31 |
290 |
| 50-54 |
100 |
36 |
9 |
14 |
159 |
| 55-59 |
98 |
38 |
11 |
12 |
159 |
| 60-64 |
103 |
44 |
12 |
11 |
170 |
| 65-69 |
125 |
50 |
15 |
11 |
201 |
| 70-74 |
166 |
53 |
18 |
11 |
248 |
| 75-79 |
205 |
48 |
17 |
11 |
281 |
| 80+ |
582 |
74 |
35 |
19 |
710 |
| TOTAL |
1,567 |
398 |
133 |
120 |
2,218 |
2000 U.S. Prevalent Cases of Glaucoma (in thousands) by Age, Gender, and Race/Ethnicity
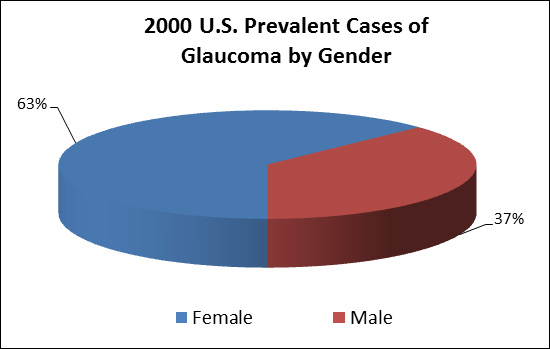
| Female/Age |
White |
Black |
Hispanic |
Other |
All |
| 40-49 |
131 |
41 |
8 |
22 |
202 |
| 50-54 |
60 |
22 |
5 |
9 |
96 |
| 55-59 |
54 |
20 |
6 |
7 |
87 |
| 60-64 |
54 |
21 |
7 |
6 |
88 |
| 65-69 |
65 |
23 |
9 |
6 |
103 |
| 70-74 |
90 |
25 |
11 |
6 |
132 |
| 75-79 |
121 |
24 |
11 |
6 |
162 |
| 80+ |
439 |
48 |
25 |
13 |
525 |
| TOTAL |
1,014 |
224 |
82 |
75 |
1,395 |
| Male/Age |
White |
Black |
Hispanic |
Other |
All |
| 40-49 |
57 |
14 |
8 |
9 |
88 |
| 50-54 |
40 |
14 |
4 |
5 |
63 |
| 55-59 |
44 |
18 |
5 |
5 |
72 |
| 60-64 |
49 |
23 |
5 |
5 |
82 |
| 65-69 |
60 |
27 |
6 |
5 |
98 |
| 70-74 |
76 |
28 |
7 |
5 |
116 |
| 75-79 |
84 |
24 |
6 |
5 |
119 |
| 80+ |
143 |
26 |
10 |
6 |
185 |
| TOTAL |
553 |
174 |
51 |
45 |
823 |

