NIDDK’s core values emphasize maintaining a strong investigator initiated R01 program, preserving a stable pool of talented new investigators, supporting key clinical studies and trials, and continuing strong support of training and career development programs, consistent with the vision of NIDDK Director, Dr. Griffin P. Rodgers (see Vision).
At NIDDK’s May 2012 Advisory Council meeting, NIDDK’s Deputy Director, Dr. Gregory Germino, highlighted these values and reviewed NIDDK’s resource focus on areas supporting the core values.
Following that presentation, NIDDK generated additional data on application and funding trends to help our research community understand application and funding dynamics over recent years and demonstrate NIDDK’s commitment to research and programs associated with NIDDK’s core values.
NIDDK Funding Outcomes for Fiscal Year (FY) 2011 and Historical Application and Funding Trends
The data in all charts exclude initiatives (i.e., RFAs), grants funded using the Type 1 Diabetes special appropriation and funds appropriated through the American Recovery and Reinvestment Act (ARRA).
Figure 1: Number of NIDDK competing R01 applications scoring within the top 50th percentile and number of NIDDK competing R01 applications funded in FY 2011.
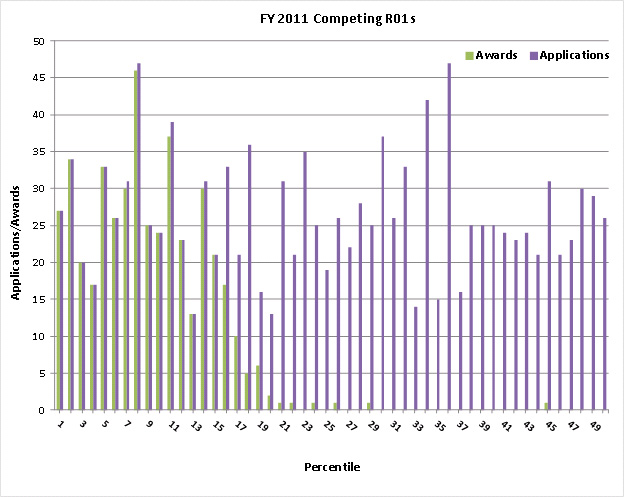
Note: "Applications" shown in the chart above include all applications that scored 50th percentile or better. Unscored applications and applications scoring above the 50th percentile are not shown (41% [n=1012] of the applications received were unscored or scored above the 50th percentile). No applications that were unscored or scored above the 50th percentile in FY 2011 were funded.
The NIDDK nominal payline in FY 2011 was the 15th percentile for established investigators and the 17th percentile for New Investigators. These data show that NIDDK closely adheres to its payline, but does exercise some programmatic discretion to reach for a limited number of especially innovative or programmatically important applications.
Figure 2: NIDDK Competing R01 Application Funding Curves for FY 2006-2011.
NIDDK Competing R01 Funding Curves (FY 2006-2011)
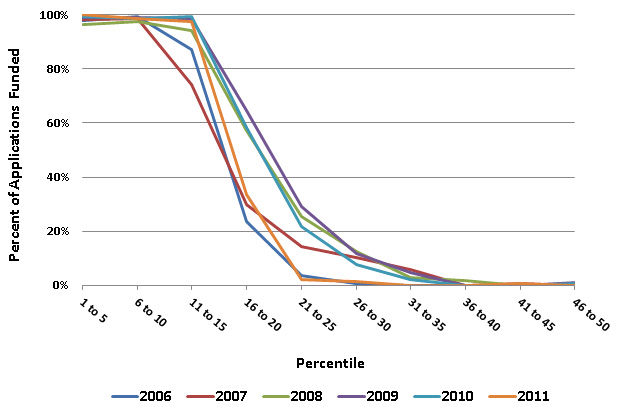
To generate the data for Figure 2, applications were placed into "percentile bins" as follows: Bin 1-5 includes all applications with percentile scores from 0.1 to 5.0, Bin 6-10 includes applications with percentile scores from 5.1 to 10.0, etc. Only applications that scored 50th percentile or better were included in the analysis.
The data demonstrate steep deflections in the percentage of applications funded at the nominal payline for each year. Paylines for the years included in Figure 2 are shown in the table below:
| Fiscal Year |
General Payline |
New Investigator Payline |
| 2006 |
14 |
16 |
| 2007 |
13 |
15 |
| 2008 |
17 |
19 |
| 2009 |
17 |
19 |
| 2010 |
17 |
19 |
| 2011 |
15 |
17 |
Figure 3: Cumulative Percentage of R01 Awards Across Percentiles (FY 2006 – 2011).
Cumulative Percentage of R01 Awards across Percentiles

Only funded applications are considered in the data set charted in Figure 3. Percentile bin size equals one percentile and there is no overlap between bins. Percentiles with decimal places were summed into the next highest integral percentile as follows: 0.1-0.9 was summed into 1, 1.1-1.9 was summed into 2, etc. These cumulative funding data again demonstrate that the vast majority of applications funded by NIDDK fall within the payline, but that NIDDK does exercise some programmatic discretion to reach for a limited number of especially innovative or programmatically important applications.
Figure 4: Number of NIDDK R01 grants (competing and noncompeting) funded in FY 1997-2011.

Overall, the total number of R01 grants funded by NIDDK has increased 26% since 1997. The major portion of this increase occurred during the years of the NIH budget doubling (1998-2003). Over the past five years there has been a slight decline in the number of grants funded. NIDDK consistently funds approximately 500 competing awards each fiscal year. In general about half of these are new (Type 1) awards and half are competing renewals, although there is some variation from year to year.
Figure 5: Number of competing NIDDK R01 applications (including revisions) received for funding consideration in FY 1998-2012.
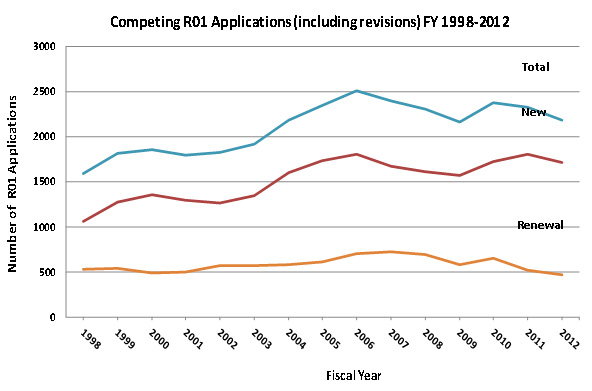
Figure 5 shows a substantial increase in the number of competing R01 applications received by NIDDK between FY 1998 and 2006. However, the numbers of competing applications have remained relatively flat since 2006. Much of the observed increase between 1998 and 2006 was primarily due to new (Type 1) applications. Submission rates for competing renewal applications fluctuated somewhat between 1998 and 2012, but overall the numbers of renewal applications have remained relatively flat.
Figure 6: Overall NIDDK expenditures (includes direct and indirect costs) on R01 awards (competing and non-competing) in FY 1995-2011
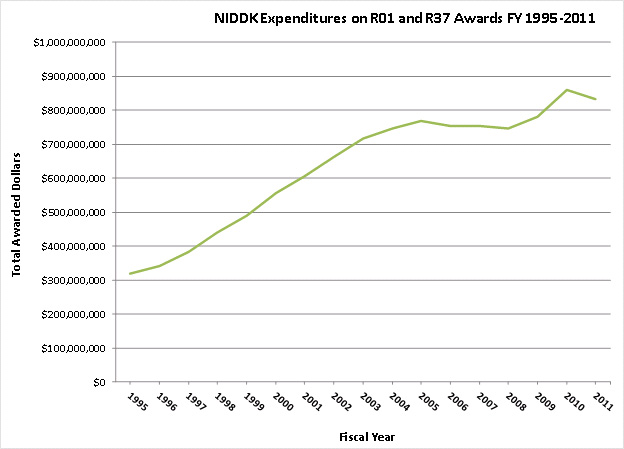
Figure 6 shows that NIDDK expenditures on R01 grants have increased markedly (162%) since 1995. This is because NIDDK is funding a larger number of these awards (Figure 4) and also because the median cost of an R01 has increased substantially (Figure 7).
Figure 7: Median total costs (includes direct and indirect costs) of NIDDK R01 grants (competing and non-competing) in FY 1995-2011
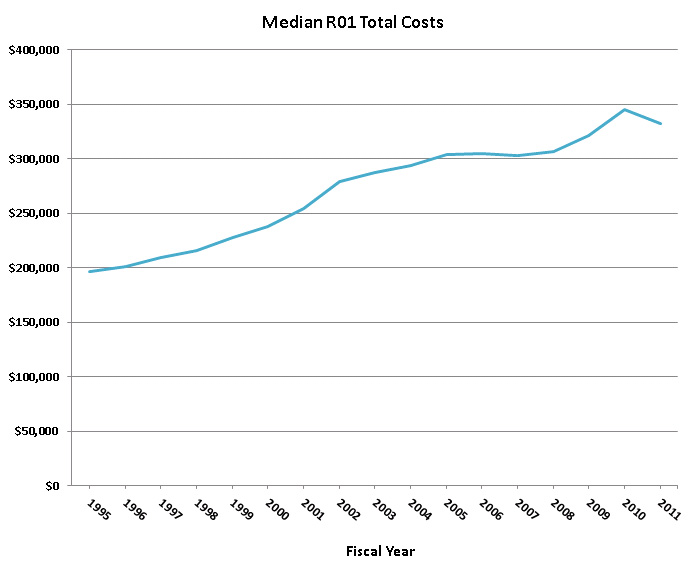
Figure 7 illustrates that the median cost of R01 awards has increased approximately 70% since 1995, although there was a slight decrease in 2011. In the past ten years (2002-2011) the number of grants receiving $500,000 or more in total costs has gone from less than 4% percent of the total number of awards to nearly 13% of the total awarded R01s. The number of grants receiving $250,000 or less in total costs has declined from over a third of the total awards to 6%.
Figure 8: NIDDK Extramural research funding by category (Competing and Non-Competing)
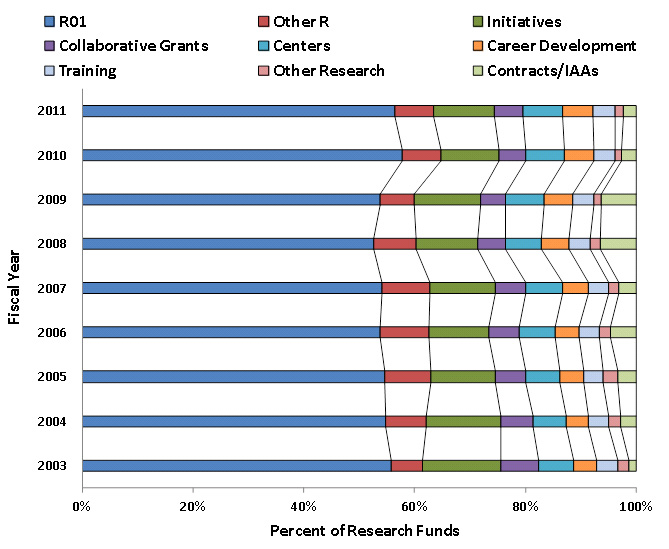
NIDDK Portfolio Categories:
- R01 – Investigator Initiated (excludes NIDDK RFAs)
- Other R – Includes other R activities (i.e., R03, R13, R15, R18, R21, R34, SBIR/STTR, etc.) but excludes applications submitted to a NIDDK RFAs and R24s
- Initiatives – Awards made in response to a NIDDK RFAs; includes most NIDDK large clinical trials and consortia.
- Collaborative Grants – P01s and R24s that are not "mini-Centers"
- Centers – Includes all non-P01 P awards and R24 "mini-Centers"
- Career Development – Includes all Ks (including K99/R00)
- Training – Includes all F and T activities
- Other Research – Everything not captured in the categories above
- Contracts and Interagency Agreements (IAAs)—Includes some large clinical studies
Figure 8 shows that relative funding levels of most NIDDK Extramural research categories have remained fairly stable since FY 2003. These data were presented to NIDDK’s Advisory Council in May 2012 in the context of NIDDK’s core values. The NIDDK core values emphasize maintaining a strong investigator initiated R01 program, preserving a stable pool of talented new investigators, supporting key clinical studies and trials (support is generally represented in the Initiatives and Contracts categories), and continuing strong support of training and career development programs. Figures 9-12 illustrate other examples of how NIDDK's portfolio has reflected NIDDK Core values over time.
Figure 9: Maintaining a Stable Pool of NIDDK Investigators: Number of Investigators Supported by at Least one R01* 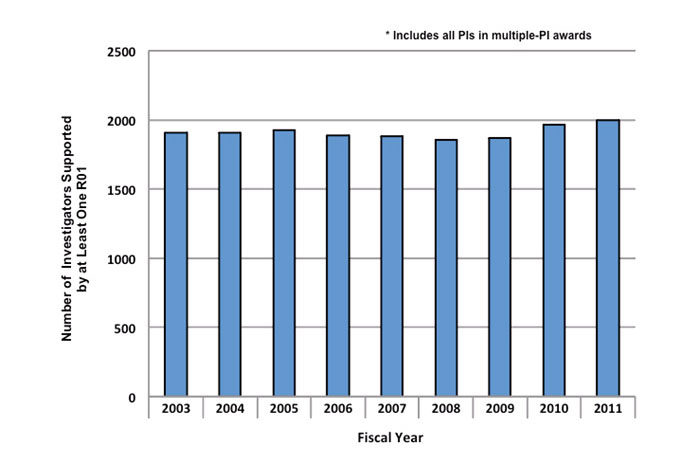
Figure 9 shows that the number of Principal Investigators (PIs) supported by at least one R01 remained relatively stable between Fiscal Year 2003 and 2009. In FYs 2010 and 2011 there were increases in the numbers of PIs supported with an NIDDK R01. It should be noted that in 2008 NIH, for the first time, began making multiple principal investigator R01 awards to support team science projects. The observed increases in numbers of PIs supported by NIDDK in FY 2010 and 2011 are largely attributable to multiple principal investigator R01 awards.
Figure 10: Preserving a Stable Pool of New Investigators: Number of NIDDK New Investigator R01 Applications and Awards
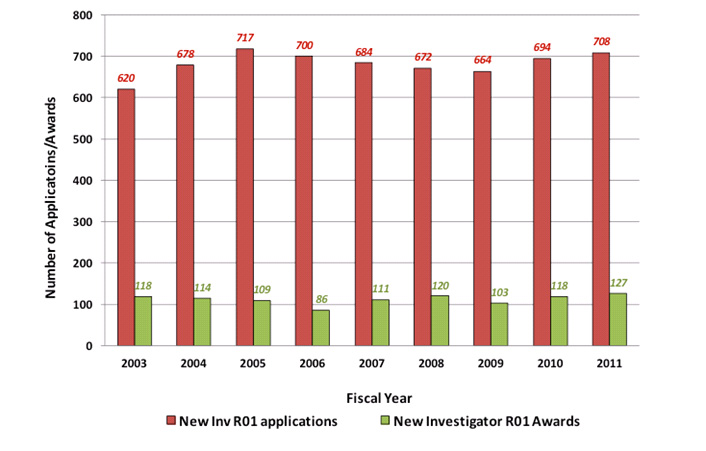
Figure 10 shows that while application rates for New Investigators have remained fairly high, there was a deceleration in the number of New Investigator awards between FY 2003 and 2006. Starting in FY 2007, NIH and NIDDK established new policies focused on New Investigators and these policies appear effective in mitigating downward pressures on New Investigator awards. It should be noted that these data count applications and awards, not persons.
Figure 11: NIDDK Human Subjects Research Funding as a Proportion of All Extramural Research Funding.
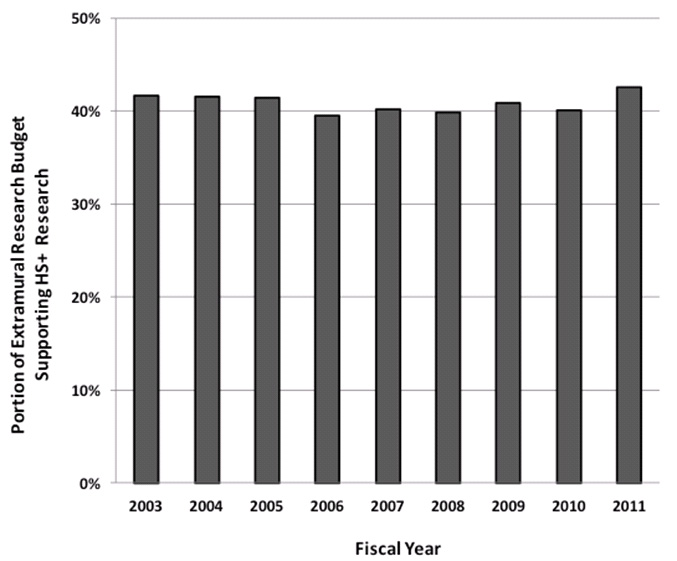
Figure 11 demonstrates that the NIDDK continues to commit a substantial proportion of its research funding to the support of clinical research involving human subjects. For the purpose of this analysis, we used the definition described in Kotchen et al, JAMA 2004 Feb; 291(7):836-43 and included all studies coded as using Human Subjects (HS+).
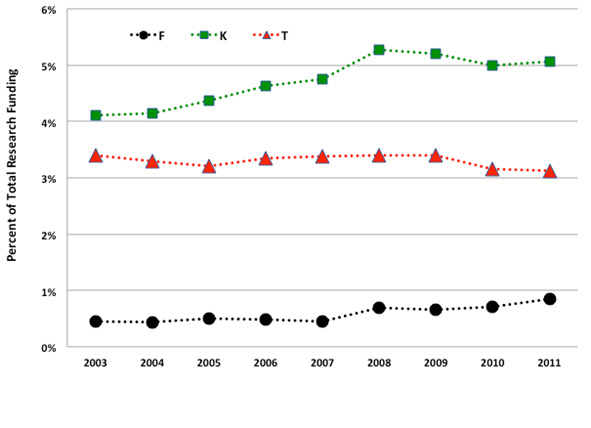
Figure 12: NIDDK Is Committed to Training the Next Generation
A. NIDDK Fellowship (F), Career Development (K), and Training (T) Awards as a Percent of Total Research Funding.
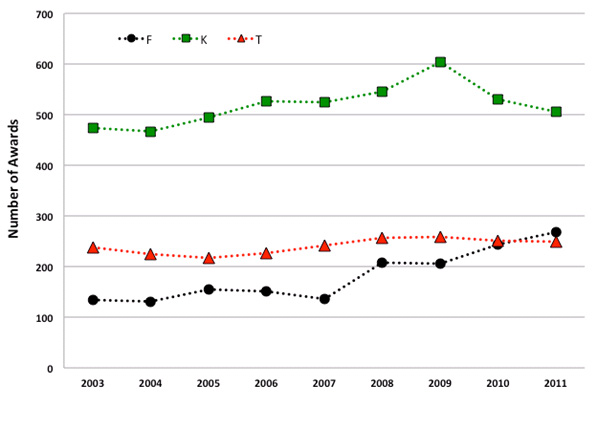
B. Number of NIDDK Fellowship (F), Career Development (K), and Training (T) Awards by Fiscal Year
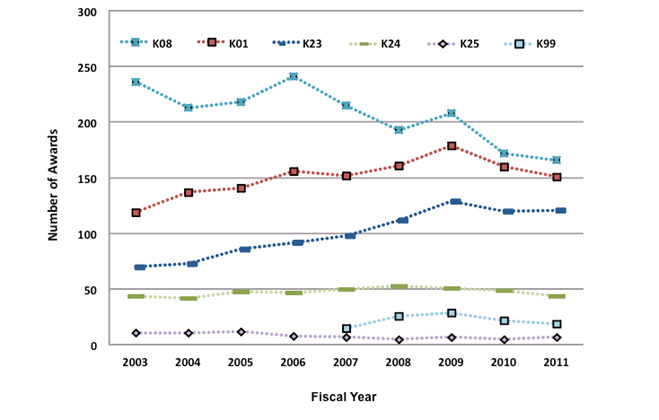
C. Number of NIDDK Career Development (K) Awards by Activity and Fiscal Year
D. Number of NIDDK Training (T32) Award Slots by Fiscal Year

Figures 12 A-D demonstrate that NIDDK’s commitment to training and developing the careers of the next generation of scientists remains strong. Figure 12 A shows that overall support of training and career development programs has increased since 2003 and that the slight deceleration of T awards support was offset by an increase in support of F awards (by design). Figures 12 B and D illustrate that the numbers of NIDDK T awards and associated training slots have remained relatively stable. Figure 12 C shows that while the numbers of NIDDK K08 (Mentored Clinical Scientist Development Award) awards decreased from 2003 to 2011, the numbers of K01 (Mentored Research Scientist Development Award) and K23 (Mentored Patient-Oriented Research Career Development Award) have increased. NIDDK will continue to monitor carefully its training and career development programs to ensure appropriate balance.