|
Unless otherwise noted, the following data are from CDC’s HIV Surveillance Report: Diagnoses of HIV Infection and AIDS in the United States and Dependent Areas, 2011; Vol. 23.
Definitions
HIV Prevalence Estimate
HIV Incidence Estimate
Diagnoses of HIV Infection
Diagnoses of HIV Infection, by Age
Diagnoses of HIV Infection, by Race/Ethnicity
Diagnoses of HIV Infection, by Transmission Category
HIV Diagnoses, by Top 10 States/Dependent Areas
Persons Living with a Diagnosis of HIV Infection
AIDS Diagnoses
AIDS Diagnoses, by Age
AIDS Diagnoses, by Race/Ethnicity
AIDS Diagnoses, by Transmission Category
Persons Living with an AIDS Diagnoses
Deaths of Persons with an AIDS Diagnoses
State-by-State HIV Infection and AIDS Data
International Statistics
Definitions
-
Diagnosis of HIV infection:
The term refers to persons diagnosed
with HIV infection, regardless of the
stage of disease at diagnosis (i.e., HIV
infection Stage 1, 2, 3 [AIDS], or
unknown), from 50 states, the District
of Columbia, and 6 U.S. dependent areas.
-
AIDS diagnosis: TThe
term refers to persons diagnosed with
Stage 3 HIV infection (AIDS), based on
CDC’s 2008 surveillance case definitions
for adults, adolescents, and children.
- 6 U.S. dependent areas included in
the data:
American Samoa, Guam, the Northern
Mariana Islands, Puerto Rico, the
Republic of Palau, and the U.S. Virgin
Islands.
- Transmission category:
The term for summarizing the multiple
risk factors that a person may have had
by selecting the one most likely to have
resulted in HIV transmission. For
surveillance purposes, persons with more
than one reported risk factor for HIV
infection are classified in the
transmission category listed first in a
hierarchy of transmission categories,
and therefore counted only once. The
exception is men who had sexual contact
with other men and injected drugs; this
group makes up a separate transmission
category.
- HIV incidence:
The estimated number of persons newly
infected with HIV during a specified
time period (e.g., a year).
- HIV prevalence:
The number of persons living with HIV at
a given time regardless of the time of
infection, whether the person has
received a diagnosis (aware of
infection), or the stage of HIV disease.
For more definitions and details about how HIV infection and AIDS data are tabulated, read the "Technical
Notes" from the
HIV Surveillance Report: Diagnoses of HIV
Infection and AIDS in the United States and
Dependent Areas, 2011.
For additional details on HIV disease surveillance,
view the Kaiser Family Foundation tutorial: Understanding HIV/AIDS Surveillance Data in the United States.
Go to top
HIV Prevalence Estimate
Prevalence is the number of people living
with HIV infection at a given time, such as
at the end of a given year.
At the end of 2009, an estimated 1,148,200 persons aged 13
and older were living with HIV infection in the United States,
including 207,600 (18.1%) persons whose infections had not been
diagnosed.1
1 CDC. Monitoring selected national HIV prevention and care objectives by using HIV surveillance data—United States and 6 U.S. dependent areas—2010. HIV Surveillance Supplemental Report 2012;17(No. 3, part A). Published June 2012.
Go to top
HIV Incidence Estimate
Incidence is the number of new HIV
infections that occur during a given year. CDC estimates that
approximately 50,000 people in the United States are newly infected
with HIV each year. In 2010 (the most recent year that data are
available), there were an estimated 47,500 new HIV infections.2
Nearly two thirds of these new infections occurred in gay and
bisexual men. Black/African American men and women were also highly
affected and were estimated to have an HIV incidence rate that was
almost 8 times as high as the incidence rate among whites. Visit the
HIV incidence page for more details.
2
CDC. Estimated HIV incidence among adults and adolescents
in the United States, 2007-2010. HIV Supplemental Report 2012).
Available at http://www.cdc.gov/hiv/topics/surveillance/
resources/reports/index.htm#supplemental.
Go to top
Diagnoses of HIV Infection
In 2011, the estimated number of
diagnoses of HIV infection in the United
States was 49,273. There were 38,825
diagnoses in adult and adolescent males and
10,257 in adult and adolescent females.
There were an estimated 192 diagnoses of HIV
infection among children aged less than 13
years at diagnosis.
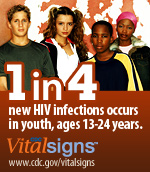
Diagnoses of HIV Infection, by Age
In 2011, the estimated number of
diagnoses of HIV infection in the United
States, by age at diagnosis, was as follows:
| Age (Years) |
Estimated Number of
Diagnoses of HIV Infection, 2011 |
| Under 13 |
192 |
| Ages 13-14 |
53 |
| Ages 15-19 |
2,240 |
| Ages 20-24 |
8,054 |
| Ages 25-29 |
7,484 |
| Ages 30-34 |
6,209 |
| Ages 35-39 |
5,285 |
| Ages 40-44 |
5,753 |
| Ages 45-49 |
5,564 |
| Ages 50-54 |
3,951 |
| Ages 55-59 |
2,312 |
| Ages 60-64 |
1,229 |
| Ages 65 or older |
948 |
Go to top
Diagnoses of HIV Infection, by Race/Ethnicity
CDC tracks diagnoses of HIV infection
information on seven racial and ethnic
groups: American Indian/Alaska Native,
Asian, black/African American,
Hispanic/Latino, Native Hawaiian/other
Pacific Islander, white, and multiple races.
In 2011, the estimated number of diagnoses
of HIV infection in the United States was as
follows:
| Race or Ethnicity |
Estimated Number of Diagnoses of HIV
Infection, 2011 |
| American Indian/Alaska Native |
212 |
| Asian |
982 |
| Black/African American |
23,168 |
| Hispanic/Latinoa |
10,159 |
| Native Hawaiian/Other Pacific Islander |
78 |
| White |
13,846 |
| Multiple Races |
827 |
a Hispanics/Latinos can be of any race.
For more details on HIV infection and
race/ethnicity, see CDC's Populations and Surveillance fact sheets.
Go to top
Diagnoses of HIV Infection, by Transmission Category
Six common transmission categories are
male-to-male sexual contact, injection drug
use, male-to-male sexual contact and
injection drug use, heterosexual contact,
mother-to-child (perinatal) transmission,
and other (includes blood transfusions and
unknown cause).
The distribution of the estimated number of
diagnoses of HIV infection among adults and
adolescents in the United States by
transmission category follows. A breakdown
by sex is provided where appropriate.
| Transmission Category |
Estimated Number of Diagnoses of HIV
Infection, 2011 |
| Adult and Adolescent Males |
Adult and Adolescent Females |
Total |
| Male-to-male sexual contact |
30,573 |
NA |
30,573 |
| Injection drug use |
2,220 |
1,428 |
3,648 |
| Male-to-male sexual contact and injection drug use |
1,407 |
NA |
1,407 |
| Heterosexual contacta |
4,588 |
8,814 |
13,402 |
| Otherb |
36 |
15 |
51 |
a Heterosexual contact with a person known to have, or to be at high risk for, HIV infection.
b Includes hemophilia, blood transfusion, perinatal exposure, and risk not reported or not identified.
The distribution of the estimated number
of diagnoses of HIV infection among children
aged less than 13 years at the time of
diagnosis in the United States, by
transmission category, follows:
| Transmission Category |
Estimated Number of Diagnoses of HIV
Infection, 2011 |
| Perinatal |
127 |
| Othera |
65 |
a Includes hemophilia, blood transfusion, and risk not reported or not identified.
Go to top
HIV Diagnoses, by Top 10 States/Dependent Areas
These are the 10 states
or dependent areas reporting the highest
number of HIV diagnoses in 2011:
| State/Dependent Area |
Number
of AIDS Diagnoses, 2011 |
| California |
5.973 |
| Florida |
5,403 |
| Texas |
5,065 |
| New York |
4,960 |
| Georgia |
2,522 |
| Illinois |
2,142 |
| Maryland |
1,783 |
| North Carolina |
1.672 |
| New Jersey |
1,567 |
| Pennsylvania |
1,545 |
Go to top
Persons Living with a Diagnosis of HIV Infection
At the end of 2010, an estimated 872,990
persons in the United States were living
with diagnosed HIV infection.
Data include persons with a diagnosis of HIV
infection regardless of the stage of disease
at diagnosis. Estimated numbers resulted
from statistical adjustment that accounted
for delays in reporting to the health
department (but not for incomplete
reporting) and missing transmission
category, where appropriate.
Because of delays in reporting of deaths,
death and prevalence data are only available
through the end of 2010. The exclusion of
data from the most recent year allows at
least 18 months for deaths to be reported
and for these persons to be removed from
calculations of persons living with
diagnosed HIV infection.
Totals include persons of unknown
race/ethnicity. Because totals for the
estimated numbers were calculated
independently of the values for the
subpopulations, the subpopulation values may
not equal these totals.
Go to top
AIDS Diagnoses
In 2011, the estimated number of persons
diagnosed with AIDS in the United States was
32,052. Of these, 24,088 AIDS diagnoses were
among adult and adolescent males, 7,949 were
among adult and adolescent females, and 15
diagnoses were among children aged less than
13 years.
The cumulative estimated number of AIDS
diagnoses through 2010 in the United States
was 1,155,792.
Estimated numbers resulted from statistical
adjustment that accounted for delays in
reporting to the health department (but not
for incomplete reporting) and missing
transmission category, where appropriate.
Cumulative totals include persons of unknown
race/ethnicity. Because totals for the
estimated numbers were calculated
independently of the values for the
subpopulations, the subpopulation values may
not equal these totals.
Go to top
AIDS Diagnoses, by Age
In 2011, the estimated number of AIDS
diagnoses in the 50 states and the District
of Columbia, by distribution of ages at time
of diagnosis, was as follows:
| Age (Years) |
Estimated Number of AIDS Diagnoses, 2011 |
| Under 13 |
15 |
| Ages 13-14 |
49 |
| Ages 15-19 |
510 |
| Ages 20-24 |
2,425 |
| Ages 25-29 |
3,433 |
| Ages 30-34 |
4,001 |
| Ages 35-39 |
4,071 |
| Ages 40-44 |
4,783 |
| Ages 45-49 |
4,994 |
| Ages 50-54 |
3,567 |
| Ages 55-59 |
2,198 |
| Ages 60-64 |
1,107 |
| Ages 65 or older |
899 |
Go to top
AIDS Diagnoses, by Race/Ethnicity
CDC tracks AIDS information on seven
racial and ethnic groups: American
Indian/Alaska Native, Asian, black/African
American, Hispanic/Latino, Native
Hawaiian/other Pacific Islander, white, and
multiple races.
In 2011, the estimated number of AIDS diagnoses in the United
States, by race or ethnicity was as follows:
| Race or Ethnicity |
Estimated # of AIDS Diagnoses, 2011 |
Cumulative Estimated # of AIDS
Diagnoses, Through 2011a |
| American Indian/Alaska Native |
146 |
3,787 |
| Asianb |
492 |
9,054 |
| Black/African American |
15,958 |
486,282 |
| Hispanic/Latinoc |
6,355 |
202,182 |
| Native Hawaiian/Other Pacific Islander |
47 |
901 |
| White |
8,304 |
435,613 |
| Multiple Races |
750 |
17,804 |
a From the beginning of the epidemic through 2011.
b Includes Asian/Pacific Islander legacy cases.
c Hispanics/Latinos can be of any race.
For more details on AIDS and race/ethnicity, see CDC's fact sheets.
Go to top
AIDS Diagnoses, by Transmission Category
CDC collect HIV and AIDS data using six
common transmission categories: male-to-male
sexual contact, injection drug use,
male-to-male sexual contact and injection
drug use, heterosexual contact,
mother-to-child (perinatal) transmission,
and other (includes blood transfusions and
unknown cause).
The distribution of the estimated number of
AIDS diagnoses among adults and adolescents
in the United States, by transmission
category, follows. A breakdown by sex is
provided where appropriate.
| Transmission Category |
Estimated Number of AIDS Diagnoses, 2011 |
| Adult and Adolescent Males |
Adult and Adolescent Females |
Total |
| Male-to-male sexual contact |
16,694 |
NA |
16,694 |
| Injection drug use |
2,346 |
1,615 |
3.961 |
| Male-to-male sexual contact and injection drug use |
1,392 |
NA |
1,392 |
| Heterosexual contacta |
3,526 |
6,206 |
9,732 |
| Otherb |
131 |
129 |
260 |
a Heterosexual contact with a person known to have, or to be at high risk for, HIV infection.
b Includes hemophilia, blood transfusion, perinatal exposure, and risk not reported or not identified.
| Transmission Category |
Cumulative Estimated Number of AIDS Diagnoses, Through 2010a |
| Adult and Adolescent Males |
Adultand Adolescent Females |
Total |
| Male-to-male sexual contact |
555,032 |
NA |
555,032 |
| Injection drug use |
187,938 |
89,800 |
277,738 |
| Male-to-male sexual contact and injection drug use |
80,902 |
NA |
80,902 |
| Heterosexual contactb |
77,521 |
136,675 |
214,196 |
| Otherc |
11,975 |
6,427 |
18,402 |
a From the beginning of the epidemic through 2011.
b Heterosexual contact with a person known to have, or to be at high risk for, HIV infection.
c Includes hemophilia, blood transfusion, perinatal exposure, and risk not reported or not identified.
The distribution of the estimated number
of AIDS diagnoses among children aged less
than 13 years at the time of diagnosis in
the 50 states and the District of Columbia,
by transmission category, follows:
Transmission Category |
Estimated Number of AIDS Diagnoses, 2010 |
Cumulative Estimated Number of AIDS Diagnoses, Through 2010a |
| Perinatal |
12 |
8,658 |
| Otherb |
2 |
863 |
a From the beginning of the epidemic through 2011.
b Includes hemophilia, blood transfusion, and risk not reported or not identified.
Go to top
Persons Living with an AIDS Diagnosis
At the end of 2010, an estimated 487,692
persons in the United States were living
with an AIDS diagnosis.
Estimated numbers resulted from statistical
adjustment that accounted for delays in
reporting to the health department (but not
for incomplete reporting) and missing
transmission category, where appropriate.
Because of delays in reporting of deaths,
data are only available through the end of
2010. The exclusion of data from the most
recent year allows at least 18 months for
deaths to be reported and for these persons
to be removed from calculations of persons
living with an AIDS diagnosis.
Totals include persons of unknown
race/ethnicity. Because totals for the
estimated numbers were calculated
independently of the values for the
subpopulations, the subpopulation values may
not equal these totals.
Go to top
Deaths of Persons with an AIDS Diagnosis
In 2010, the estimated number of deaths
of persons ever receiving a diagnosis of
AIDS in the United States was 15,529.
The cumulative estimated number of deaths of persons with an AIDS
diagnosis in the United States, through 2010, was 636,048.
Deaths of persons with an AIDS diagnosis may be due to any cause.
Estimated numbers resulted from statistical adjustment that
accounted for delays in reporting to the health department (but not
for incomplete reporting) and missing transmission category, where
appropriate. Because of delays in reporting of deaths, data are only
available through the end of 2010. The exclusion of data from the
most recent year allows at least 18 months for deaths of persons
with an AIDS diagnosis to be reported.
Totals include persons of unknown race/ethnicity. Because totals for
the estimated numbers were calculated independently of the values
for the subpopulations, the subpopulation values may not equal these
totals.
Go to top
State-by-State HIV infection and AIDS Data
- NCHHSTP Atlas
- NCHHSTP State Profiles
- Statehealthfacts.org
provides state-by-state information
about new and cumulative AIDS
diagnoses, AIDS diagnosis rates,
persons living with an AIDS
diagnosis, AIDS deaths, diagnoses of
HIV infections, HIV testing
statistics and policies, additional
AIDS-related state policies, Ryan
White funding and other funding for
HIV prevention, and AIDS Drug
Assistance Programs, including
budget, client, and expenditure data
from the Kaiser Family Foundation.
Go to top
International Statistics
For the most up-to-date information on
international HIV infection and AIDS
statistics, visit the Joint United Nations Programme on HIV/AIDS.
For current statistics on the number of reported AIDS cases in North, Central, and South America,
please contact the Pan American Health Organization (PAHO),
which also serves as the Regional Office for the Americas of the World Health Organization at 525 23rd Street, N.W., Washington, D.C. 20037; telephone: 202-974-3000.
Other international Web sites with information on HIV and AIDS
are the
World Health Organization (WHO) and the
United States Agency for International
Development (USAID).
Go to top |