
Welcome to WISQARSTM
![]() WISQARSTM (Web-based Injury Statistics Query and Reporting System) is an interactive database system that provides customized reports of injury-related data. Learn more about WISQARSTM >>
WISQARSTM (Web-based Injury Statistics Query and Reporting System) is an interactive database system that provides customized reports of injury-related data. Learn more about WISQARSTM >>
NOTE TO USERS: In September, 2012, the Nonfatal Injury Reports module was updated with new national-level population estimates based on recently released bridged-race intercensal estimates of the July 1, 2001-July 1, 2009 and April 1, 2010 resident population of the United States. See U.S. Census Populations With Bridged Race Categories (http://www.cdc.gov/nchs/nvss/bridged_race.htm). On November 28, 2012, the Fatal Injury Reports and Years of Potential Life Lost (YPLL) were updated with new national and state-level intercensal population estimates, which recently became available. Similarly, on December 17, 2012, Violent Death (NVDRS) Reports was also updated with these new state-level population estimates. Crude and age-adjusted death and YPLL rates computed using these revised population estimates may differ from those based on the previous bridged-race postcensal population estimates for 2001-2009, especially with respect to race and Hispanic origin.
Fatal Injury Data
Death certificate data from the National Vital Statistics System — deaths, death rates, and years of potential life lost (a measure of premature death) by specific causes of injury mortality and common causes of death.
Nonfatal Injury Data
National estimates of injuries treated in U.S. hospital emergency departments from the National Electronic Injury Surveillance System - All Injury Program (NEISS-AIP) — nonfatal injuries and nonfatal injury rates.
Violent Deaths (NVDRS)
Data from the National Violent Death Reporting System (NVDRS) — violent incidents and deaths, death rates, and causes of injury mortality. Data provided for 16 states and are not nationally representative.
New! Cost of Injury Reports
Motor Vehicle Traffic Deaths and Estimated Lifetime Medical Costs, by Sex, 2005
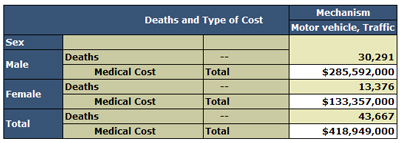
WISQARS™ provides cost estimates for injury deaths (including violent deaths) and nonfatal injuries where the patient was treated and released from a hospital or ED.
Mapping Module
The map to the right shows geospatially smoothed, age-adjusted motor vehicle traffic death rates by county (highest rates are shown in brown). Motor vehicle traffic death rates were generally higher in rural areas in the United States from 2000 to 2006.
Other Injury Data Resources
- Ten Leading Causes of Death and Injury
- More about Injury Data and Statistics, including Injury Coding and Data Systems
Get email updates
To receive email updates about this page, enter your email address:
Contact Us:
- Centers for Disease Control and Prevention
National Center for Injury Prevention and Control (NCIPC)
4770 Buford Hwy, NE
MS F-63
Atlanta, GA 30341-3717 - 800-CDC-INFO
(800-232-4636)
TTY: (888) 232-6348 - Contact CDC–INFO
