NCI Tools
ColorTool for ArcMap
ColorTool is a plugin for ArcMap™ (part of the Esri ArcGIS Desktop suite) that helps users create choropleth maps using ColorBrewer color ramps.
The program runs from a button in the toolbar and opens a form that guides the user in choosing a classification scheme. For more information on the color options, visit ColorBrewer2.org. ColorTool supports Quantile, Equal Interval, Natural Breaks (Jenks), and Unique Value classification types.
-

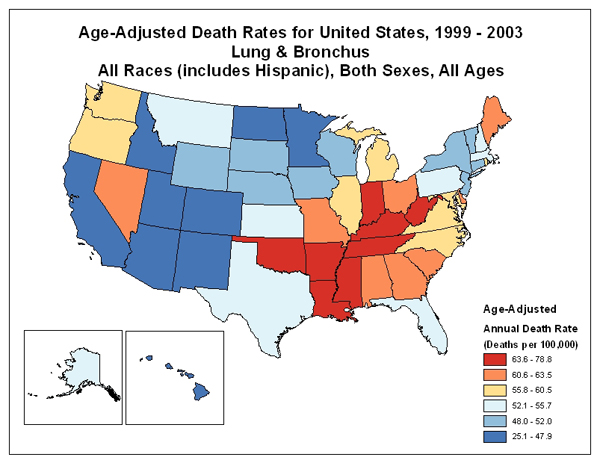
This map was created using ColorTool's diverging red-yellow-blue, six-group theme with a Quantile classification.
-
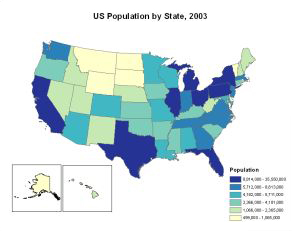
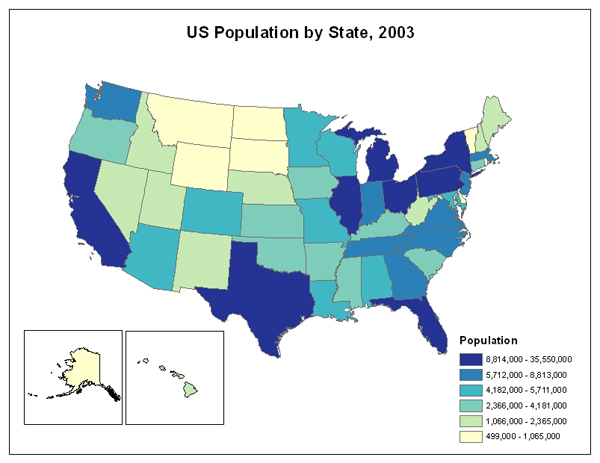
This map uses a dual-color sequential color scheme and Quantile classification to display population data.
There are also legend options, area borders, and exclusion statements in the tool. ColorTool simplifies the display process by offering preset color schemes and eliminating incompatible options.
To learn more about ColorTool, browse the help system. For help with installing or using ColorTool, e-mail ColorTool Technical Support.