DEPARTMENT OF HEALTH AND HUMAN SERVICES
NATIONAL INSTITUTES OF HEALTH
National Institute of Biomedical Imaging and Bioengineering
Fiscal Year 2010 Budget
Congressional Justfication
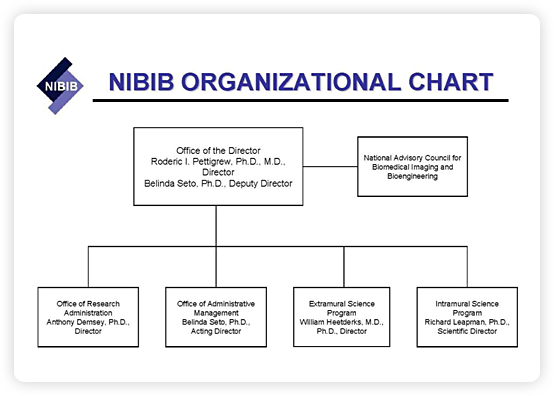
Organization Chart

Back to Top
Appropriation Language
For carrying out section 301 and title IV of the Public Health Service Act with respect to biomedical imaging and bioengineering research, [$308,208,000] $312,687,000 (Department of Health and Human Services Appropriations Act, 2009)
Back to Top
Amounts Available for Obligation 1/
Table
|
Source of Funding
|
FY 2008 Actual |
FY 2009 Estimate |
FY 2010 Estimate |
| Appropriation |
$303,955,000 |
$308,208,000 |
$312,687,000 |
| Rescission |
-5,310,000 |
0 |
0 |
| Supplemental |
1,588,000 |
0 |
0 |
| Subtotal, adjusted appropriation |
300,233,000 |
308,208,000 |
312,687,000 |
| Real transfer under Director's one-percent transfer authority (GEI) |
-507,000 |
0 |
0 |
| Comparative transfer under Director's one-percent transfer authority (GEI) |
507,000 |
0 |
0 |
| Subtotal, adjusted budget authority |
300,233,000 |
308,208,000 |
312,687,000 |
| Unobligated balance, start of year |
0 |
0 |
0 |
| Unobligated balance, end of year |
0 |
0 |
0 |
| Subtotal, adjusted budget authority |
300,233,000 |
308,208,000 |
312,687,000 |
| Unobligated balance lapsing |
0 |
0 |
0 |
| Total obligations |
300,233,000 |
308,208,000 |
312,687,000 |
1/ Excludes the following amounts for reimbursable activities carried out by this account: FY 2008 - $3,962,000 FY 2009 Estimate -$3,962,000 FY 2010 Estimate - $3,962,000 Excludes $7,854 Actual in FY 2008, Estimate $75,000 in FY 2009 and Estimate $75,000 in FY 2010 for royalties.
Back to Top
Budget Mechanism Table
Table
(Dollars in Thousands)
| MECHANISM |
FY 2008
Actual |
FY 2009
Estimate |
FY 2010
Estimate |
Change |
| Research Grants: |
Number |
Amount |
Number |
Amount |
Number |
Amount |
Number |
Amount |
| Research Projects: |
| Noncompeting |
427 |
$150,434 |
402 |
$159,421 |
349 |
$148,088 |
(53) |
-$11,333 |
| Administrative supplements |
(15) |
923 |
(15) |
923 |
(15) |
923 |
(0) |
0 |
| Competing: |
| Renewal |
43 |
24,002 |
34 |
19,358 |
43 |
24,853 |
9 |
5,495 |
| New |
131 |
39,734 |
101 |
31,585 |
127 |
40,549 |
26 |
8,964 |
| Supplements |
0 |
0 |
0 |
0 |
0 |
0 |
0 |
0 |
| Subtotal, competing |
174 |
63,736 |
135 |
50,943 |
170 |
65,402 |
35 |
14,459 |
| Subtotal, RPGs |
601 |
215,093 |
537 |
211,287 |
519 |
214,413 |
(18) |
3,126 |
SBIR/STTR |
44 |
7,598 |
43 |
7,498 |
44 |
7,599 |
1 |
101 |
| Subtotal, RPGs |
645 |
222,691 |
580 |
218,785 |
563 |
222,012 |
(17) |
3,227 |
Research Centers: |
| Specialized/comprehensive |
6 |
8,823 |
6 |
9,105 |
6 |
9,242 |
0 |
137 |
| Clinical research |
0 |
0 |
0 |
0 |
0 |
0 |
0 |
0 |
| Biotechnology |
17 |
17,814 |
18 |
18,384 |
18 |
18,660 |
0 |
276 |
| Comparative medicine |
0 |
0 |
0 |
0 |
0 |
0 |
0 |
0 |
| Research Centersin Minority Institutions |
0 |
0 |
0 |
0 |
0 |
0 |
0 |
0 |
| Subtotal, Centers |
23 |
26,637 |
24 |
27,489 |
24 |
27,902 |
0 |
413 |
Other Research: |
| Research careers |
35 |
4,587 |
36 |
4,734 |
37 |
4,805 |
1 |
71 |
| Cancer education |
0 |
0 |
0 |
0 |
0 |
0 |
0 |
0 |
| Cooperative clinical research |
0 |
0 |
0 |
0 |
0 |
0 |
0 |
0 |
| Biomedical researchsupport |
0 |
0 |
0 |
0 |
0 |
0 |
0 |
0 |
| Minority biomedical research support |
0 |
0 |
0 |
0 |
0 |
0 |
0 |
0 |
| Other |
15 |
1,039 |
15 |
1,072 |
15 |
1,088 |
0 |
16 |
| Subtotal, Other Research |
50 |
5,626 |
51 |
5,806 |
52 |
5,893 |
1 |
87 |
| Total Research Grants |
718 |
254,954 |
655 |
252,080 |
639 |
255,807 |
(16) |
3,727 |
Research Training: |
FTTPs |
|
FTTPs |
|
FTTPs |
|
|
|
| Individual awards |
34 |
1,194 |
34 |
1,206 |
34 |
1,218 |
0 |
12 |
| Institutional awards |
182 |
7,979 |
252 |
11,059 |
255 |
11,170 |
3 |
111 |
| Total, Training |
216 |
9,173 |
286 |
12,265 |
289 |
12,388 |
3 |
123 |
Research & development contracts |
16 |
12,113 |
22 |
16,519 |
22 |
16,696 |
0 |
177 |
| (SBIR/STTR) |
(3) |
(18) |
(3) |
(18) |
(3) |
(18) |
(0) |
(0) |
| |
FTEs |
|
FTEs |
|
FTEs |
|
FTEs |
|
| Intramural research |
26 |
7,931 |
26 |
10,913 |
27 |
11,077 |
1 |
164 |
| Research management and support |
59 |
16,062 |
60 |
16,431 |
61 |
16,719 |
1 |
288 |
| Construction |
|
0 |
|
0 |
|
0 |
|
0 |
| Buildings and Facilities |
|
0 |
|
0 |
|
0 |
|
0 |
| Total, NIBIB |
85 |
300,233 |
86 |
308,208 |
88 |
312,687 |
2 |
4,479 |
Includes FTEs which are reimbursed from the NIH Roadmap for Medical Research
Back to Top
Budget Authority by Program Activity
Table
(Dollars in Thousands)
| |
FY 2006
Actual |
FY 2007
Actual |
FY 2008
Actual |
FY 2008
Comparable |
FY 2009
Estimate |
FY 2010
Estimate |
Change |
Extramural Research
Detail: |
FTEs |
Amount |
FTEs |
Amount |
FTEs |
Amount |
FTEs |
Amount |
FTEs |
Amount |
FTEs |
Amount |
FTEs |
Amount |
| Applied Science and Technology |
|
$160,734 |
|
$153,819 |
|
$160,047 |
|
$160,554 |
|
$162,712 |
|
$164,471 |
|
$1,758 |
| Discovery Science and Technology |
|
100,331 |
|
100,331 |
|
96,793 |
|
96,793 |
|
95,081 |
|
96,139 |
|
1,059 |
| Technological Competitiveness– Bridging the Sciences |
|
16,249 |
|
22,137 |
|
18,893 |
|
18,893 |
|
23,071 |
|
24,281 |
|
1,210 |
Subtotal, Extramural |
|
277,314 |
|
276,287 |
|
275,733 |
|
276,240 |
|
280,864 |
|
284,891 |
|
4,027 |
Intramural research |
5 |
3,802 |
5 |
4,265 |
26 |
7,931 |
26 |
7,931 |
26 |
10,913 |
27 |
11,077 |
1 |
164 |
Res. management & support |
43 |
15,490 |
54 |
15,828 |
59 |
16,062 |
59 |
16,062 |
60 |
16,431 |
61 |
16,719 |
1 |
288 |
TOTAL |
48 |
296,606 |
59 |
296,380 |
85 |
299,726 |
85 |
300,233 |
86 |
308,208 |
88 |
312,687 |
2 |
4,479 |
Includes FTEs which are reimbursed from the NIH Roadmap for Medical Research
Back to Top
Major Changes in the Fiscal Year 2010 Budget Request
Major changes by budget mechanism and/or budget activity detail are briefly described below. Note that there may be overlap between budget mechanism and activity detail and these highlights will not sum to the total change for the FY 2010 budget request for NIBIB, which is +$4.479 million more than the FY 2009 Enacted, for a total of $312.687 million.
Research Project Grants (+$3.126 million, total $214.413 million): NIBIB will support a total of 519 Research Project Grant (RPG) awards in FY 2010 (excluding SBIR/STTR).The number of noncompeting awards will decrease by 53 and the funding level will decrease by $11.333 million. The number of competing RPGs will increase by 35 and the funding level will increase by $14.459 million. The NIH budget policy for RPGs in FY 2010 provides a 2% inflationary increase in noncompeting awards and a 2% increase in the average cost for competing RPGs.
Technological Competitiveness- Bridging the Sciences (+$1.210 million; total $24.281 million): In FY 2010 NIBIB will commence the second phase of the Quantum Grant program with $6.000 million, an increase of $1.000 million over the FY 2009 costs of phase one awards. The goal of the Quantum program is to profoundly improve the detection, diagnosis, prevention or treatment of major diseases or national public health problems with new technologies.
Back to Top
Summary of Changes
Table
| FY 2009 enacted |
$308,208,000 |
| FY 2010 estimated budget authority |
312,687,000 |
| Net change |
4,479,000 |
| |
FY 2009
Enacted Base |
Change from Base |
| |
Budget |
Budget |
| CHANGES |
|
Authority |
|
Authority |
A. Built-in:
1. Intramural research: |
|
|
|
|
a. Annualization of January
2009 pay increase |
|
$1,593,000 |
|
$19,000 |
| b. January FY 2010 pay increase |
|
1,593,000 |
|
24,000 |
| c. Payment for centrally furnished services |
|
1,186,000 |
|
24,000 |
d. Increased cost of laboratory supplies,
materials,and other expenses |
|
8,134,000 |
|
131,000 |
| Subtotal |
|
|
|
198,000 |
2. Research management and support: |
|
|
|
|
a. Annualization of January
2009 pay increase |
|
$8,165,000 |
|
$98,000 |
| b. January FY 2010 pay increase |
|
8,165,000 |
|
122,000 |
| c. Payment for centrally furnished services |
|
2,778,000 |
|
56,000 |
d. Increased cost of laboratory supplies,
materials, and other expenses |
|
5,488,000 |
|
94,000 |
| Subtotal |
|
|
|
370,000 |
Subtotal, Built-in |
|
|
|
568,000 |
| |
No. |
|
No. |
|
| B. Program: |
|
|
|
|
| 1. Research project grants: |
|
|
|
|
| a. Noncompeting |
402 |
$160,344,000 |
(53) |
($11,333,000) |
| b. Competing |
135 |
50,943,000 |
35 |
14,459,000 |
| c. SBIR/STTR |
43 |
7,498,000 |
1 |
101,000 |
| Total |
580 |
218,785,000 |
(17) |
3,227,000 |
| 2. Research centers |
24 |
27,489,000 |
0 |
413,000 |
| 3. Other research |
51 |
5,806,000 |
1 |
87,000 |
| 4. Research training |
286 |
12,265,000 |
3 |
123,000 |
| 5. Research and development contracts |
22 |
16,519,000 |
0 |
177,000 |
| Subtotal, extramural |
|
|
|
4,027,000 |
| |
FTEs |
|
FTEs |
|
| 6. Intramural research |
26 |
10,913,000 |
1 |
(34,000) |
| 7. Research management and support |
60 |
16,431,000 |
1 |
(82,000) |
| Subtotal, program |
|
308,208,000 |
|
3,911,000 |
| Total changes |
86 |
|
2 |
4,479,000 |
Back to Top
Fiscal Year 2010 Budget Graphs
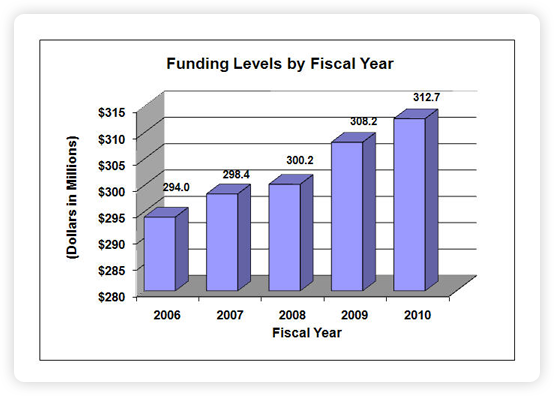
History of Budget Authority and FTEs:

Distribution by Mechanism
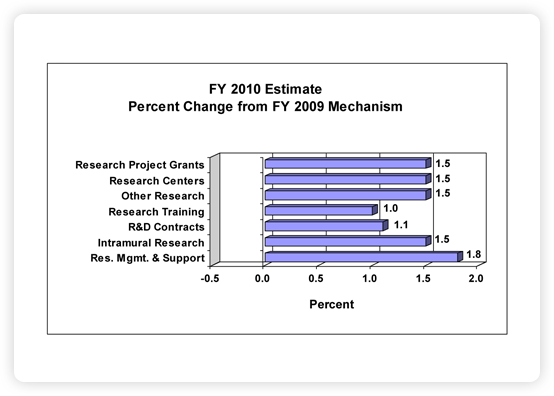
Change by Selected Mechanisms

Back to Top
Goto Page 2
Go to Page3
Last Updated On 10/14/2011