Storm Prediction Center WCM Page
Intro | 2012 U.S. Tornado Summary | State Summaries | U.S. Annual Tornado Maps | 2013 Preliminary Reports to Date
Monthly Tornadoes Since 1950 | Bi-monthly Tornadoes by ENSO Phase Strength
Watch Frequency Maps | 20y Annual Average Watches by County | SPC AWIPS Products | Data | SVR GIS |
| Warning Coordination Meteorologist's Introduction |
|---|
Welcome to the WCM Page for the SPC. This page has charts of the latest preliminary severe storm reports, annual summaries, and links to comma-separated-value (csv) data files from the SPC severe weather database back to 1950. As time allows, this page may occasionally serve as a place for preliminary severe weather event assessments.
For additional insight into severe thunderstorms and tornado reports, the SPC and the National Severe Storms Laboratory are collaborating on posting non-operational "feature" content to the U.S. Severe Weather Blog, hosted by NOAA Public Affairs in Norman, Oklahoma.
Check out the annual tornado maps from 1950 through 2009 at the WCM's Annual Tornado Maps page.
Greg Carbin
Warning Coordination Meteorologist
NWS/NCEP Storm Prediction Center
|
| Preliminary Annual U.S. Tornado Summary for 2012 |
|---|

Information about the tornadoes of 2012.
(Click for pdf version.)
|
| Preliminary Summary of Christmas Day 2012 Tornadoes |
|---|

Click for full-resolution graphic/map.
|
| Annual Tornado Maps (1952-2011) |
|---|
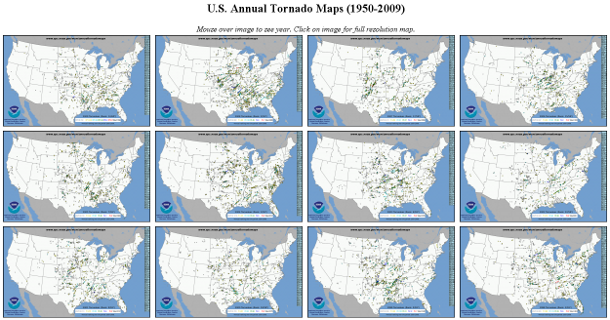
(Click on the maps to go to the Annual Tornado Maps page.)
|
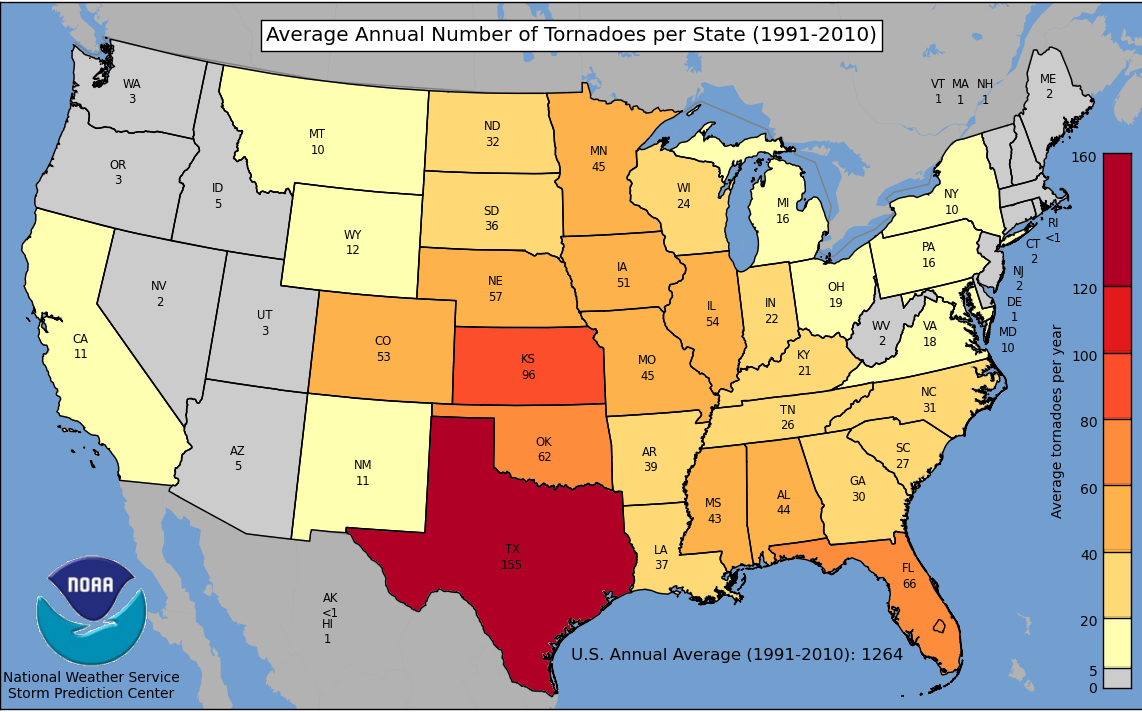
| Annual Average Number of Tornadoes by State |
|
|
| Annual Average Number of Tornado Deaths by State |
|
|
| Other U.S. Tornado Summaries |
|---|
|
|
| U.S. Monthly Tornado Counts, 1950-2010 |
|---|

Monthly tornado sums (excluding (E)F0 tornadoes) for each month, 1950-2010.
(Click to go to calendar page.)
|
| Daily Counts and Annual Running Trend (Updated Frequently) |
|---|
|
|
ENSO Strength and Bi-monthly U.S. Tornadoes since 1950
(Click link above to go to ENSO page.) |
|---|
| 2012 SPC Watch Frequency Maps |
|---|
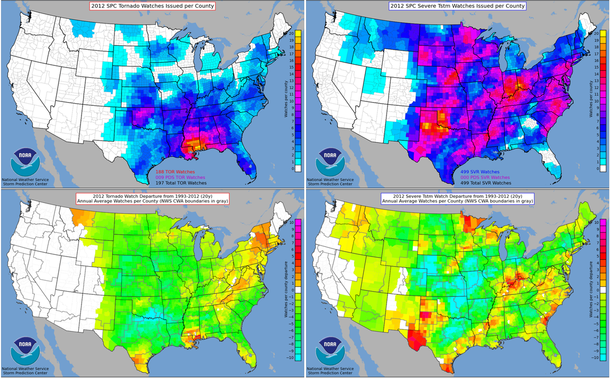
2012 Tornado and Severe Watch Count by County and Anomaly
(Click for full-resolution version.)
|
| 2011 SPC Watch Frequency Maps |
|---|

2011 Tornado and Severe Watch Count by County and Anomaly
(Click for full-resolution version.)
|
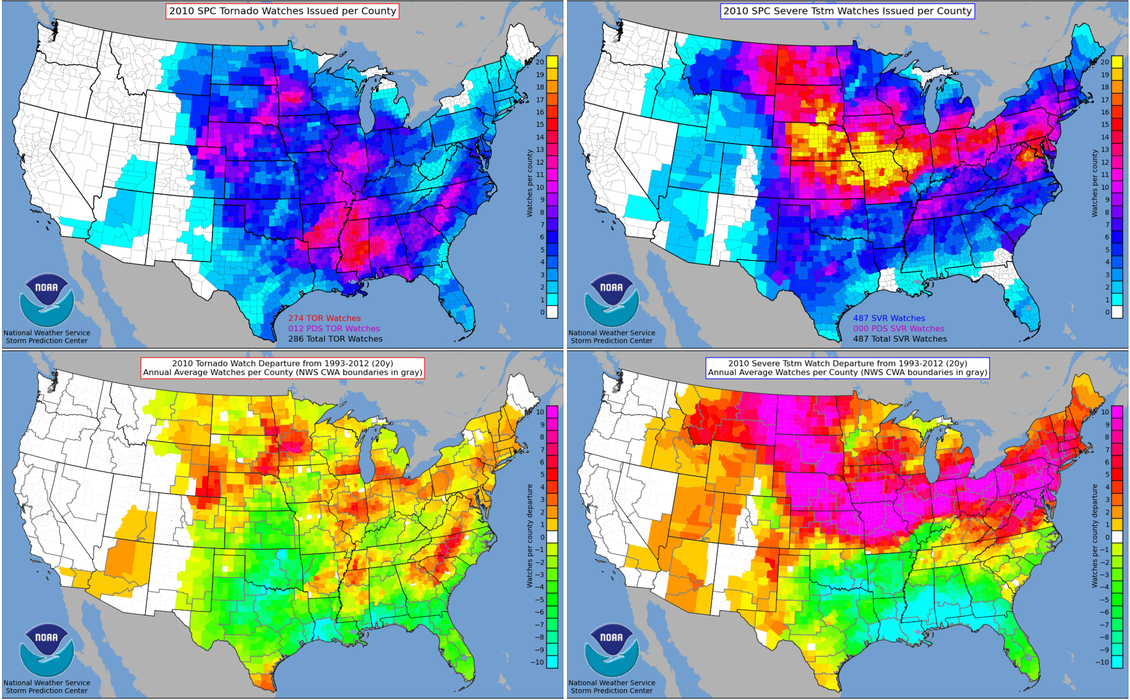
| 2010 SPC Watch Frequency Maps |
|---|
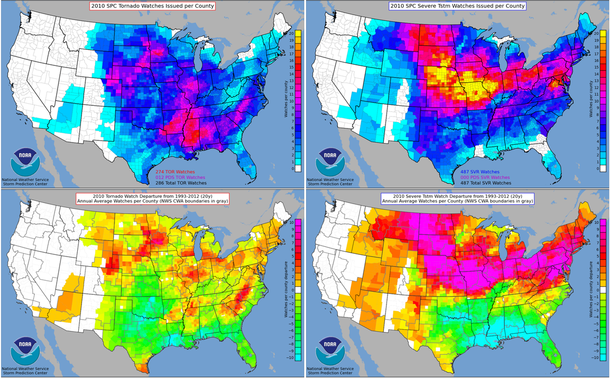
2010 Tornado and Severe Watch Count by County and Anomaly
(Click for full-resolution version.)
|
| 2009 SPC Watch Frequency Maps |
|---|
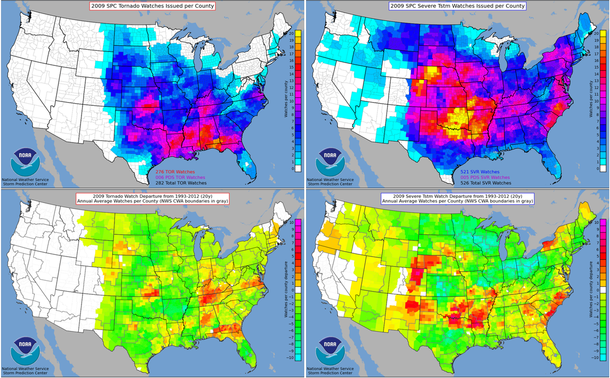
2009 Tornado and Severe Watch Count by County and Anomaly
(Click for full-resolution version.)
|
| SPC Average Annual Watch Frequency Maps |
|---|

Average number of tornado watches per year (1993-2012).
(Click for full-resolution version.)
|
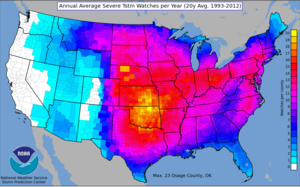
Average number of severe thunderstorm watches per year (1993-2012).
(Click for full-resolution version.)
|
|
| SPC Tornado and Severe Weather Statistical Products on AWIPS |
|---|
Monthly Tornado Statistics are maintained in the AWIPS product STAMTS. Use this product to
find out how many tornadoes have occured so far this year and how
this year compares to past years.
Killer Tornado Statistics are listed in the AWIPS product STATIJ. Use this product for
information about killer tornadoes this year and in the past.
|
| Severe Weather Database Files (1950-2011) |
|---|
The table below provides links to comma separated value (.csv) files for tornado, hail, and damaging wind data as compiled in Storm Data.
Tornado reports exist back to 1950 while hail and damaging wind reports date from 1955. The full datasets are very large, especially hail and wind. To facilitate quicker downloads these data have been parsed by decade (1950s through 1990s), half-decade or less (from 2000 to the present).
This document describes the format of the .csv files. Note! Severe hail criteria was changed from 0.75 inch minimum to 1.00 inch minimum in 2009. However, for legacy purposes, 0.75 inch hail reports continue to be included in the latest year's csv files. Download the files and sort accordingly if needed. describes the format of the .csv files. Note! Severe hail criteria was changed from 0.75 inch minimum to 1.00 inch minimum in 2009. However, for legacy purposes, 0.75 inch hail reports continue to be included in the latest year's csv files. Download the files and sort accordingly if needed.
|
Location Codes for Storm data here.
Map of State FIPS Numbers here.
Text list of County FIPS Numbers here.
|
| SPC Severe GIS Page |
|---|
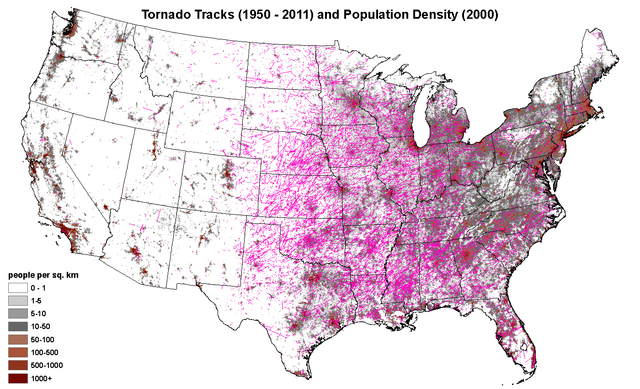
U.S. map depicting tornado tracks and population density.
(Click to go to SPC Severe GIS Page.)
|
Top/Forecast Products/Home
|


 @NWSSPC


