Skip to Content
National Cancer Institute U.S. National Institutes of Health
Colorectal Cancer Mortality Projections: Modeling the impact of interventions on US cancer mortality

Chemotherapy >

Chemotherapy Input Graphs through 2020

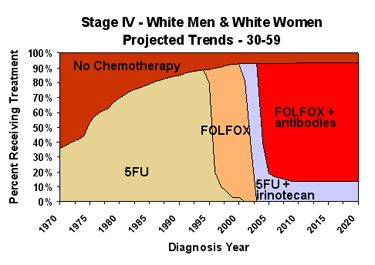
White Males and Females: Stage IV Colorectal Cancer

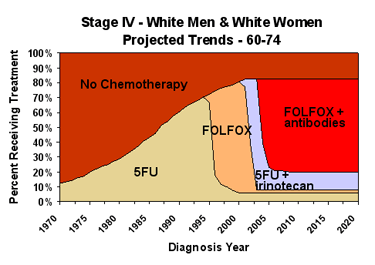
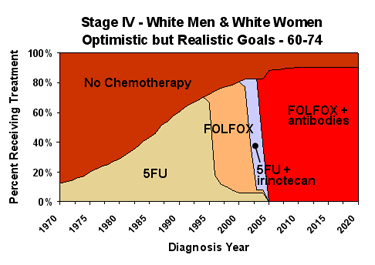
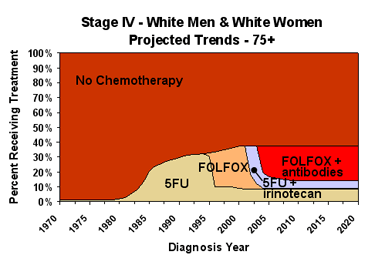
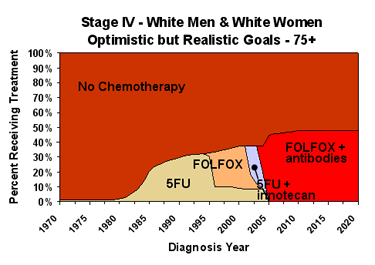
These area charts show the proportion of patients who receive each chemotherapy regimen under the model assumptions based on analyses of the SEER-Medicare linked dataset covering 1970 - 2002, and extrapolated for patients aged less than 65 years at diagnosis based on Patterns-of-Care studies. The charts on the left show current and projected chemotherapy use, and the charts on the right show chemotherapy use under our optimistic but realistic scenario. You can also download the chart data.
Chemotherapy Distribution by Scenario and Age Group

Chemotherapy Graph of Projected Trends for White Males and Females ages 30-59 Chemotherapy Graph of Optimistic but Realistic Goals for White Males and Females ages 30-59
Chemotherapy Graph of Projected Trends for White Males and Females ages 60-74 Chemotherapy Graph of Optimistic but Realistic Goals for White Males and Females ages 60-74
Chemotherapy Graph of Projected Trends for White Males and Females ages 75+ Chemotherapy Graph of Optimistic but Realistic Goals for White Males and Females ages 75+

Return to top

 Last modified: December 23, 2010 Accessibility | Privacy Policies | File Formats   
CISNET Home National Cancer Institute Department of Health and Human Services National Institutes of Health USA.gov