Age-Related Macular Degeneration (AMD)
AMD Defined
AMD is a leading cause of vision loss in the U.S. It destroys the macula, the part of the eye that provides sharp, central vision needed for seeing objects clearly. Prevalence estimates are on late AMD, involving neovascular AMD and geographic atrophy.
On this page:
2010 U.S. Age-Specific Prevalence Rates for AMD by Age and Race/Ethnicity

| Age |
White |
Black |
Hispanic |
Other |
All |
| 50-54 |
0.27% |
0.56% |
0.55% |
0.56% |
0.36% |
| 55-59 |
0.32% |
0.68% |
0.67% |
0.68% |
0.41% |
| 60-64 |
0.49% |
0.83% |
0.82% |
0.83% |
0.57% |
| 65-69 |
0.88% |
1.02% |
1.01% |
1.01% |
0.91% |
| 70-74 |
1.74% |
1.25% |
1.24% |
1.23% |
1.63% |
| 75-79 |
3.57% |
1.53% |
1.51% |
1.51% |
3.16% |
| 80+ |
13.59% |
2.22% |
2.12% |
2.13% |
11.73% |
| TOTAL |
2.46% |
0.94% |
0.90% |
0.92% |
2.09% |

2010 Prevalence Rates of AMD by Race
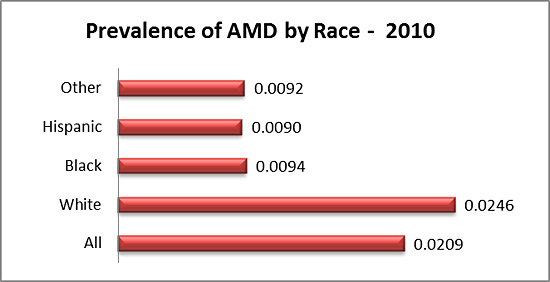
| |
All |
White |
Black |
Hispanic |
Other |
| Prevalence |
0.021 |
0.025 |
0.009 |
0.009 |
0.009 |
2010 U.S. Prevalent Cases of AMD (in thousands) by Age, and Race/Ethnicity

| Age |
White |
Black |
Hispanic |
Other |
All |
| 50-54 |
43 |
14 |
13 |
8 |
78 |
| 55-59 |
45 |
15 |
13 |
8 |
81 |
| 60-64 |
62 |
14 |
11 |
8 |
95 |
| 65-69 |
85 |
12 |
9 |
6 |
112 |
| 70-74 |
126 |
11 |
9 |
6 |
152 |
| 75-79 |
209 |
11 |
7 |
6 |
233 |
| 80+ |
1,279 |
20 |
14 |
8 |
1,321 |
| TOTAL |
1,849 |
97 |
76 |
50 |
2,072 |
2010 U.S. Prevalent Cases of AMD (in thousands) by Age, Gender, and Race/Ethnicity

| Female/Age |
White |
Black |
Hispanic |
Other |
All |
| 50-54 |
16 |
9 |
8 |
5 |
38 |
| 55-59 |
16 |
10 |
8 |
5 |
39 |
| 60-64 |
23 |
9 |
7 |
5 |
44 |
| 65-69 |
35 |
8 |
6 |
4 |
53 |
| 70-74 |
60 |
7 |
6 |
4 |
77 |
| 75-79 |
114 |
7 |
5 |
4 |
130 |
| 80+ |
935 |
14 |
10 |
6 |
965 |
| TOTAL |
1,199 |
64 |
50 |
33 |
1,346 |
| Male/Age |
White |
Black |
Hispanic |
Other |
All |
| 50-54 |
27 |
5 |
5 |
3 |
40 |
| 55-59 |
29 |
5 |
5 |
3 |
42 |
| 60-64 |
39 |
5 |
4 |
3 |
51 |
| 65-69 |
50 |
4 |
3 |
2 |
59 |
| 70-74 |
66 |
4 |
3 |
2 |
75 |
| 75-79 |
95 |
4 |
2 |
2 |
103 |
| 80+ |
344 |
6 |
4 |
2 |
356 |
| TOTAL |
650 |
33 |
26 |
17 |
726 |
Projections for AMD (2010-2030-2050)
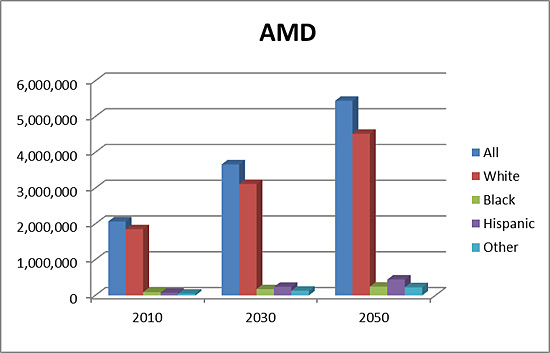
| Year |
All |
White |
Black |
Hispanic |
Other |
| 2010 |
2,069,403 |
1,850,413 |
92,035 |
76,202 |
50,752 |
| 2030 |
3,664,044 |
3,114,721 |
177,707 |
239,962 |
131,654 |
| 2050 |
5,442,265 |
4,520,743 |
247,075 |
446,478 |
227,969 |
Changes of Cases between 2000 and 2010
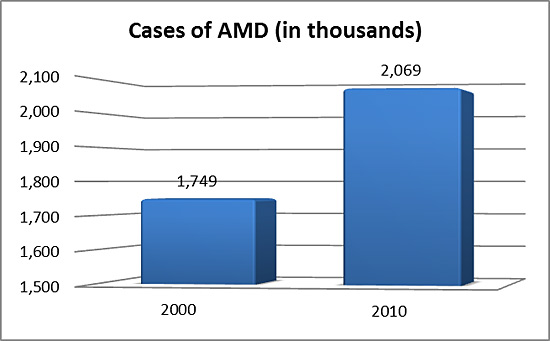
| Year |
Value |
Short Value |
| 2000 |
1,749,382 |
1,749 |
| 2010 |
2,069,403 |
2,069 |
2000 U.S. Prevalent Cases of AMD (in thousands) by Age, and Race/Ethnicity

| Age |
White |
Black |
Hispanic |
Other |
All |
| 50-54 |
37 |
9 |
8 |
5 |
59 |
| 55-59 |
33 |
9 |
6 |
5 |
53 |
| 60-64 |
42 |
9 |
6 |
5 |
62 |
| 65-69 |
68 |
9 |
6 |
4 |
87 |
| 70-74 |
128 |
9 |
6 |
4 |
147 |
| 75-79 |
224 |
8 |
5 |
3 |
240 |
| 80+ |
1,055 |
14 |
7 |
5 |
1,081 |
| TOTAL |
1,587 |
67 |
44 |
31 |
1,729 |
2000 U.S. Prevalent Cases of AMD (in thousands) by Age, Gender, and Race/Ethnicity

| Female/Age |
White |
Black |
Hispanic |
Other |
All |
| 50-54 |
14 |
6 |
5 |
3 |
28 |
| 55-59 |
12 |
6 |
4 |
3 |
25 |
| 60-64 |
16 |
6 |
4 |
3 |
29 |
| 65-69 |
29 |
6 |
4 |
3 |
42 |
| 70-74 |
63 |
6 |
4 |
3 |
76 |
| 75-79 |
129 |
6 |
3 |
2 |
140 |
| 80+ |
801 |
11 |
5 |
4 |
821 |
| TOTAL |
1,064 |
47 |
29 |
21 |
1,161 |
| Male/Age |
White |
Black |
Hispanic |
Other |
All |
| 50-54 |
23 |
3 |
3 |
2 |
31 |
| 55-59 |
21 |
3 |
2 |
2 |
28 |
| 60-64 |
26 |
3 |
2 |
2 |
33 |
| 65-69 |
39 |
3 |
2 |
1 |
45 |
| 70-74 |
65 |
3 |
2 |
1 |
71 |
| 75-79 |
95 |
2 |
2 |
1 |
100 |
| 80+ |
254 |
3 |
2 |
1 |
260 |
| TOTAL |
523 |
20 |
15 |
10 |
568 |

