
- Overview
- GIS at NCI
- Geovisualization Tools Development
GIS at NCI
Geovisualization Tools Development
As part of a broader program of data visualization research, NCI staff and their collaborators have developed a number of methods to better communicate cancer statistics visually, such as by maps and new graph designs. Examples of work in this area are:
- Weighted Nonparametric Smoothing (Headbanging)
- Tools implemented as ArcGIS Extensions
- Conditioned choropleth maps
- Linked micromap plot
- Combining statistical clustering algorithms with new visualization tools
Weighted Nonparametric Smoothing (Headbanging)
"Head-banging" is a weighted two-dimensional median-based smoothing algorithm, developed to reveal underlying geographic patterns in data where the values to be smoothed do not have equal variances. The Head-Bang software helps users apply this algorithm to data.
Proportion of residents with no health insurance: CDC Behavioral Risk Factor Surveillance System
-
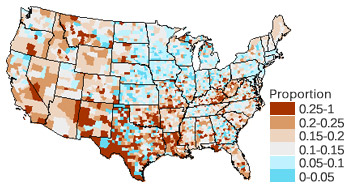
Original Data
-
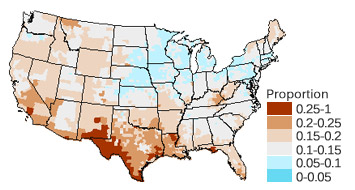
Smoothed Data
Data: Pickle & Su, American Journal of Preventive Medicine, 2002
Headbanging: Mungiole et al., Statistics in Medicine, 1999
Tools implemented as ArcGIS Extensions
-
Color Choices:
ColorBrewer / (Download ColorTool Extension)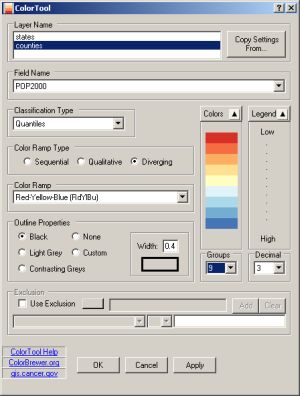
-
Headbang Smoothing:
(Download HeadBang for ArcMap™)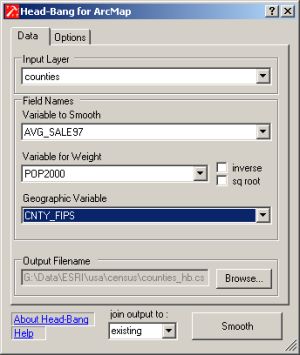
-
SaTScan Clustering:
(Download Cluster Analysis Extension)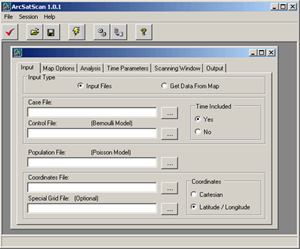
-
Utility to Format SEER*Stat Data for Mapping:
(Download SEER*Stat Bridge)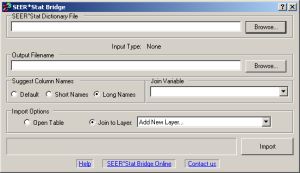
Conditioned choropleth maps
- Decomposes a single choropleth map into strata according to 1 or 2 other factors
- Interactive tool - users control classifications of mapped variable (red/gray/blue) & stratifiers by sliders
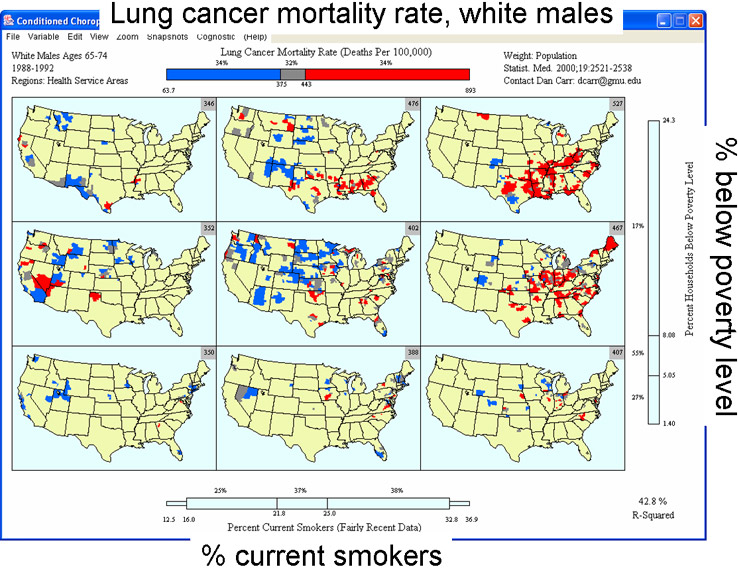
Carr, Wallin, and Carr, Statistics in Medicine 2000 [D]
Carr, Wallin, and Carr, Statistics in Medicine 2000
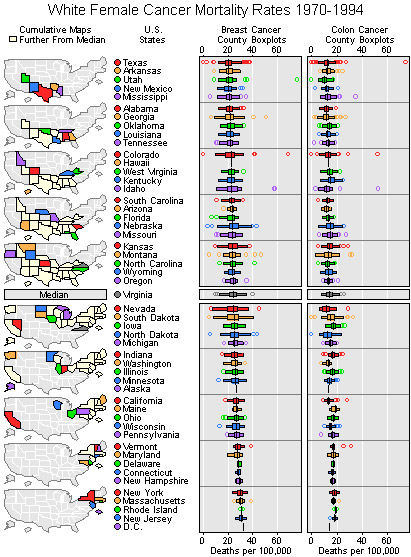
Linked Micromap Plot
- Color links statistical graphs & maps
- Micromaps show spatial patterns
- Supports different glyphs & sorting
Combining Statistical Clustering Algorithms with New Visualization Tools
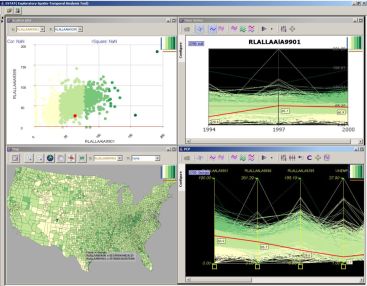
Exploratory Spatio-Temporal Analysis Tool (ESTAT):
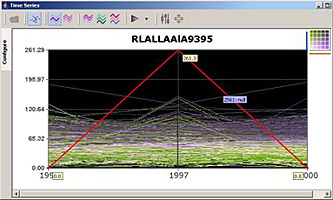
- Time trend plots of cancer rates
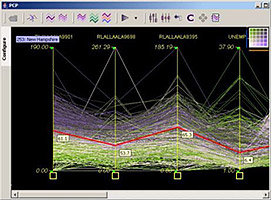
- Parallel coordinate plot of risk factors, confounders
- Scatter plots, maps
- Statistical summaries
- Supports linking, brushing, variable & option selection
Alan MacEachren, Penn State University (www.geovista.psu.edu)