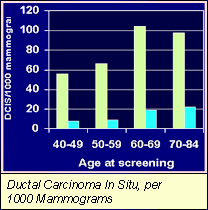
Ductal Carcinoma In Situ, per 1000 Mammograms
Can Surveys Tell Us If We’re Making Progress Against Cancer?
BenchMarks talked with Martin Brown, Ph.D., who has been the chief of NCI’s Health Services and Economics Branch since October 1999. His research has focused on the economic burden of cancer to individuals and society; the cost-effectiveness of specific cancer prevention and control interventions; and the relationship of socioeconomic status, community structure, and health system organization to access and use of cancer prevention and control services. Dr. Brown talked with BenchMarks about the various surveys his branch has conducted on these topics and how they measure success in fighting cancer. The following is an edited interview with Dr. Brown.
How do we know if screening or treatment is affecting cancer mortality and morbidity in the U.S. population?
Dr. Brown: NCI supports an extensive body on research on the evaluation of screening in clinical practice, including several major initiatives, such as the Breast Cancer Surveillance Consortium and the Cancer Research Network, and extensive investigator-initiated research. In addition, NCI funds national studies on the surveillance of patterns of care to examine screening or treatment modalities that have been shown to be effective, be it in gold standard, randomized, controlled clinical treatment trials or other trials which produce lower levels of evidence. Based on that evidence and consensus recommendations, we then track to what degree screening and treatment services are actually delivered. When you do that, you often find a mixed picture for many reasons. This tracking tells us what effects we are having on morbidity and mortality. It tells us to what degree we are achieving effectiveness with our treatments and prevention strategies, like smoking interventions.
We’ve tracked dissemination of the most basic treatment recommendations for many cancers, such as breast cancer and colorectal cancer where randomized trials are well, well established and adjuvant therapies and hormonal therapies are effective when delivered to the appropriate populations. In addition, we track new treatments that are not know to be effective but that may be having major effects in the population, either in terms of benefit or unanticipated adverse effects.
The good news is that our surveillance studies show that treatments for breast and colorectal cancer have been fairly widely disseminated in a reasonable period of time (years as opposed to decades) — it wasn’t instantaneous and it wasn’t complete, but if we hadn’t done these studies, we wouldn’t know that. For example, consensus recommendations for adjuvant therapy for node-negative breast cancer were issued in 1990 and one study showed that use of this form of chemotherapy increased from less than 13 percent in 1987 to 57 percent in 1995.
We wouldn’t know if the news was good, bad or indifferent if we didn’t do the surveys. In most cases, we find that certain groups aren’t getting the treatments as widely as we might expect. This may have something to do with minority populations or populations with less health insurance. It’s also true of older patients.
In earlier decades, trials and surveillance often looked at younger males. Do you need to address this bias now?
Dr. Brown: Clinical trials, out of necessity, include a very select sample of individuals to examine the effect of new interventions, such as treatment for cancer. NCI, and NIH overall, has made a major effort over the last decade to broaden the groups involved in clinical trials. In contrast to trials that are very selective in the sample of people included, surveillance or monitoring for health issues in the United States and other countries is specifically designed to be representative of the population and so includes men and women, all relevant age groups, and racial and ethnic groups within the U.S. We are expanding efforts to ensure we are collecting information from a sufficient number of people in various racial/ethnic groups and in populations where concern has been raised about their health status or the care they receive.
However, there are additional questions we need to address. With older patients, we don’t know if they’re under-treated or if there are other mitigating circumstances, such as high levels of co-morbidity (other diseases that put you at risk). In some cases, our research shows that we may have to go back and do additional clinical trials — enroll important groups of people, such as the elderly. Sometimes there were good reasons for looking at younger men, but there’s a growing recognition that we need to design trials that focus on older patients, as well.
How good are your surveys on delivery of health care resources?
Dr. Brown: To what degree are resources being delivered in our health care area? We don’t have very good information on this. We need to develop more provider surveys that track this, and we’re planning more in the future.
Non-profit, research-oriented HMOs (Health Maintenance Organizations) are carrying out research projects with us that examine to what degree these services are being delivered to their enrollees. In theory, everyone is covered, but, in practice, that’s not the case and these HMOs are doing a survey to see the extent to which services are being provided. They’re also using electronic medical records to track delivery and to measure usage — it will be important to find out if this works. This is contingent on the availability of electronic medical records (from which patient identifiers have been removed), and hopefully, these records will be more readily available in the future.
How accurately can you measure what it costs to treat cancer?
Dr. Brown: We’ve developed data that allow us to track the cost of treating cancer in a very specific way. We know what the treatment cost is for early-stage breast cancer six months following diagnosis — how much is surgery, how much is chemotherapy, etc. We know that from a policy standpoint these data are very useful.
If you’ve got a screening program, you want to know how many procedures are being done, what type of procedures — these data will be helpful. Then we need to know which professionals perform these procedures.
We found out, for example, that most sigmoidoscopies are done by primary care physicians, but that they’re done at very low volume, which leads to a high cost for the procedure. We found that physicians believe that when someone is diagnosed with an adenoma, the number of monitoring exams that the patient gets is much higher than recommended in national guidelines. If this is being done, that’s a cost that’s unnecessary. This is a very complicated topic.
How good are the various surveys you’ve conducted? Are telephone surveys better than written surveys, for example?
Dr. Brown: Over the years, it’s becoming more and more difficult to get responses to surveys. People are suspicious of being approached by all the telemarketers that are out there. Lots of people do surveys and many of these are small, local surveys done by academics and local health departments. That’s fine, but they often cover local, specialized populations. They don’t have the resources to get out there and get a high response rate, and they don’t often test their questionnaire items to make sure the questions address the intended issues and are understood by the people answering them.
We try in all of our surveys to use the most thorough and up-to-date survey technologies. In most of our surveys, we make sure that the people surveyed are actually representative of the population. We do everything we possibly can to get a response rate close to 80 percent or more, which is very difficult. Which means that we often do door-to-door surveys.
We also try to do various sorts of validation studies. If we’re asking if women have had a mammogram in the past two years, there’s a series of surveys that compare them with medical records to see if the information is accurate.
Is the information totally accurate? No. But is it pretty good at tracking overall patterns of usage for which these surveys were designed? Yes. This is not true of all surveys.
The Behavioral Risk Factor Surveillance System administered by the CDC (Centers for Disease Control and Prevention) and conducted by states and done by telephone gets variable response rates. They give state-level estimates that our national health surveys don’t give. At the NCI we try to combine the strengths and weaknesses of the state surveys with those we conduct to get the best possible results. We can use the national health survey to adjust the state rates.
The survey of colorectal screening practices is one of private care physicians, gastrointestinal specialists, surgeons, and HMOs. This survey was developed with collaborative input from experts at the CDC, the American Cancer Society, the Center for Medicare and Medicaid Services, and research centers across the U.S. Many physician surveys have a response rate of 35 to 50 percent, but we achieved a response rate of 75 to 80 percent. The survey is nationally representative. We utilize all the current methodology about survey design and implementation and we are now proposing to carry out a regular series of these provider surveys.
Can we document a correlation between cancer control (having a program in a community to reduce cancer rates) and outcome?
Dr. Brown: Answering that question is one of our key goals in surveillance, and it is difficult. It is more difficult than people would begin to think. For instance, contrary to what a lot of people believe, there has never been a randomized, controlled trial to study if Pap smears can reduce cervical cancer incidence or mortality.
Pap smears began before the fairly recent era of randomized, controlled trials. The reason people believe that it actually works is that there were dramatic historical data from Finland that showed that very complete Pap smear programs had effects very rapidly. The incidence of cervical cancer fell very rapidly in tandem with the Pap smear program. There are still some skeptics who believe that other factors may be involved. In the end, you must sort out the other factors that can be evaluated and monitored.
Mammography usage showed a big increase from the mid-80s to the 1990s in the U.S. and has reached the level of usage of organized programs in Europe. In order to effectively measure impact you need to reach a level of usage of 70 percent or more. It took the U.S. a while to get there, but by 2000 the U.S. reached the 70 percent usage level for mammography.
We know that there’s been a decrease in mortality due to breast cancer. We’re looking to see to what degree screening mammography affected this decrease. To really detect an effect on a population basis you need a 70 percent or higher usage level. To estimate cause is a relatively rare event, and there’s a delay effect. Trials that examine these issues in a very focused way need to run for 10 to 15 years at a minimum before you can declare that an intervention is working.
Can we make a correlation between screening usage and promotions in the news or other venues?
Dr. Brown: Why did use of mammography increase relatively rapidly while the use of colorectal cancer screening has remained at a much lower level of closer to 30%? There are many reasons. It is interesting that in both cases there are issues of news coverage. When Ronald Reagan had colon cancer, which was localized, that media event had a real impact. We tracked calls to NCI’s Cancer Information Service and there was a huge spike in calls. We also looked at colorectal screening procedures billed to Medicare, which at the time was the only good source for tracking things annually. Screening levels increased a fair amount and then stayed up, so there was an enduring impact. We’re tracking data to see what kind of impact Katie Couric’s on-air colonoscopy in March 2000 had on screening.
What we don’t know is the capacity to deliver colorectal screening. There are many modalities (fecal occult blood test, sigmoidoscopy, colonoscopy, double contrast barium enema), but what kind of systems do we have in place for follow-up, etc.? Many health systems are struggling with this issue. If you’re a large HMO, you’d be trying to decide which test to use, promote, and follow up, and these are huge resource issues. One of the reasons you don’t see colorectal screening increasing rapidly is that radiologists all knew they needed mammogram machines to perform breast X-rays, but with colorectal screening, there’s a wide array of modalities to choose from.
What are the factors that influence access to care?
Dr. Brown: Examining the issue of health disparities in cancer is an ongoing area of research at the NCI. We know that disparities exist in care and outcomes for several groups in the U.S. including some racial and ethnic groups, older people, the poor, and those without health insurance. However, much more work is needed to address these disparities and identify how best to correct the disparities.
Racial minorities, on average, have lower income, lower access to health care and insurance. And these factors, we know, are very heavily associated with not getting screened. However, there may also be some issues of cultural values, discrimination, and other factors. Racial and ethnic groups may have different access to health care resources due to established health care patterns in the community.
We’re trying to do more research to understand this. If there’s no access and the facilities aren’t there or are substandard, it’s harder. We’ve got a collaboration with HRSA (Health Resources and Services Administration) to try to understand why these problems exist and to try to overcome them.
Do you have a standard way of tracking physician practices for your surveys?
Dr. Brown: We’ve done national provider surveys occasionally. I led one in 1992 of radiation mammography facilities that gave us a benchmark of what was going on in mammography. Then in 2000, we sampled primary care physicians and got a high response rate. We think that these surveys have been very useful, and we hope to institutionalize these as a regular activity.
In 2000, we gave physicians a choice in how they wanted to respond to our surveys. They could fill out a written form, they could do it on the Internet, or they could fax or phone in a response. Most responded by paper but about 10 to 15 percent did it over the Web. That was in 2000, so if we do this again in 2004 or 2005, it will be interesting to see what method physicians use.
Are there state-by-state data available for physician surveys?
Dr. Brown: There’s no way to break this out by states because our resources are limited, and it would be incredibly expensive to get a sample size that could be broken down by state. However, we do post our survey instruments on our Web page and anyone can make use of them. Several investigators in the past have used our survey instruments to replicate our results at the state level. Other federal agencies also do provider surveys but few of these relate to cancer control issues and none allow state-by-state comparisons.
What sort of comparisons do you conduct to validate your data?
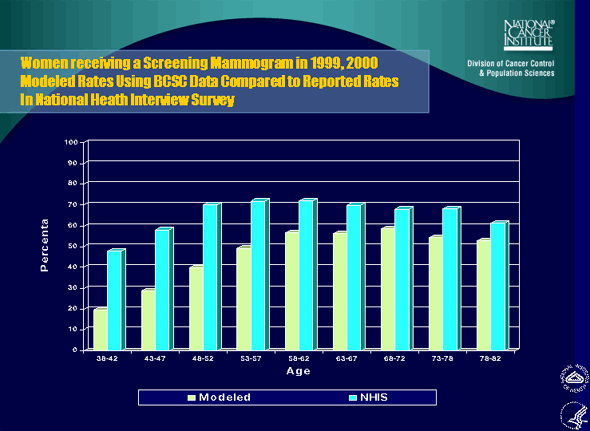
Dr. Brown: We do very sophisticated statistical modeling to sort out confounding factors and the relative effects of screening and treatment. Knowing that a woman has had a mammogram in the last one or three years doesn’t tell us enough. What we really need to know to predict or understand the effect of mammography on outcomes (such as disease or death) for every woman in the country is at what age they started getting mammograms and whether they have them every year — we need that pattern of data to understand what the effect might be. We combine data sources to do this when one source isn’t sufficient. We’re now not just asking if you had a mammogram, but when and how often. The National Health Interview Survey gives us an overall national picture and the Breast Cancer Surveillance Consortium data help us understand the more detailed pattern of use.
Animation/Video
View the Archived Webcast of NCI Science Writer’s Seminar,
“New Cancer Statistics: Making Them Relevant to Your Readers” at NIH VideoCasting. The seminar was held on September 2, 2003.
Audio Clips
-
Martin Brown, Ph.D, NCI, discusses the costs of treating cancer and how to determine how effectively treatments are disseminated into a community.
( Audio – Length: 00:52 )
Text Transcript
Martin Brown, Ph.D, NCI, discusses the costs of treating cancer and how to determine how effectively treatments are disseminated into a community.
Dr. Brown: We’ve developed data that allow us to track the cost of treating cancer in a very specific way. We know what the treatment cost is for early-stage breast cancer six months following diagnosis — how much is surgery, how much is chemotherapy, etc. We know that from a policy standpoint these data are very useful.
If you’ve got a screening program, you want to know how many procedures are being done, what type of procedures — these data will be helpful. Then we need to know which professionals perform these procedures.
We found out, for example, that most sigmoidoscopies are done by primary care physicians, but that they’re done at very low volume, which leads to a high cost for the procedure. We found that physicians believe that when someone is diagnosed with an adenoma, the number of monitoring exams that the patient gets is much higher than recommended in national guidelines. If this is being done, that’s a cost that’s unnecessary. This is a very complicated topic.
-
Martin Brown, Ph.D., NCI, discusses how NCI tracks physician practices through the use of surveys.
( Audio – Length: 02:03 )
Text Transcript
Martin Brown, Ph.D., NCI, discusses how NCI tracks physician practices through the use of surveys.
Dr. Brown: We’ve done national provider surveys occasionally. I led one in 1992 of radiation mammography facilities that gave us a benchmark of what was going on in mammography. Then in 2000, we sampled primary care physicians and got a high response rate. We think that these surveys have been very useful, and we hope to institutionalize these as a regular activity.
In 2000, we gave physicians a choice in how they wanted to respond to our surveys. They could fill out a written form, they could do it on the Internet, or they could fax or phone in a response. Most responded by paper but about 10 to 15 percent did it over the Web. That was in 2000, so if we do this again in 2004 or 2005, it will be interesting to see what method physicians use.
Photos/Stills
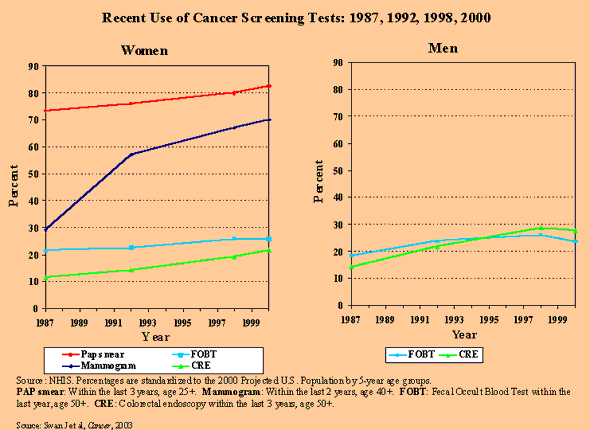
1. Recent Use of Cancer Screening Tests: 1987, 1992, 1998, 2000
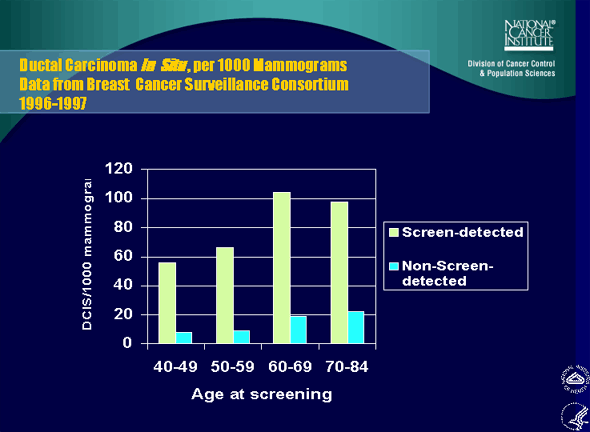
2. Ductal Carcinoma In Situ , per 1000 Mammograms Data from Breast Cancer Surveillance Consortium 1996-1997
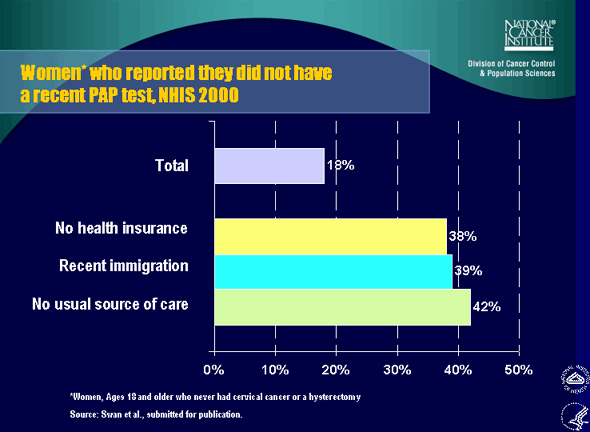
3. Women who reported they did not have a recent PAP test, NHIS 2000
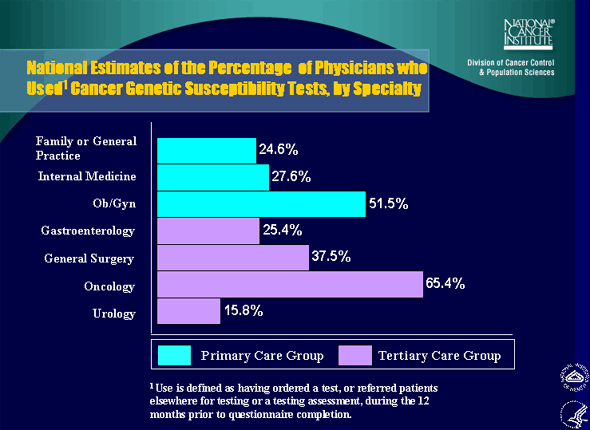
4. National Estimates of the Percentage of Physicians who Used Cancer Genetic Susceptibility Tests, by Specialty
5. Women receiving a Screening Mammogram in 1999, 2000: Modeled Rates Using BCSC Data Compared to Reported Rates In National Heath Interview Survey
 NCI NewsCenter
 NCI Budget Data
 Visuals Online
 NCI Fact Sheets
 Understanding Cancer Series