Data & Statistics
CDC introduces Disability and Health Data System. With this system, users can customize how they view disability and health data throughout the country, making it easy to understand health disparity information, identify trends, and support the development of fiscally-responsible, evidence-based programs, services and policies.
Click here to learn more.
In the United States
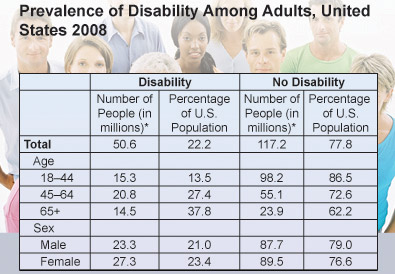
- More than 50 million—which is about 1 in 5—Americans report having some level of disability. [Read article]
 D
D
* Weighted Population
- Data from the U.S. Census Bureau’s Survey of Income and Program Participation (SIPP) showed that there were 54 million people with a disability and, of those, 35 million (12%) reported having a severe disability. [Read report]
- The chance of having a disability goes up with age, from less than 10% for people 15 years of age or younger, to almost 75% for people 80 years of age or older. With good health habits and access to health care, many disabilities can be delayed or even prevented. [Read report]
View your state's prevalence of disability
 D
D
Racial and Ethnic Differences in Health Status, 2004–2006
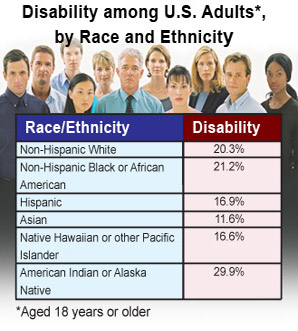
- The prevalence of disability among U.S. adults ranged from 11.6% among Asians to 29.9% among American Indians and Alaska Natives.
- Self-rated health status was reported as:
- Fair or poor among 40.3% of adults with a disability compared with 9.9% of adults without a disability.
- Good among 32.5% of adults with a disability compared with 29.9% of adults without a disability.
- Excellent or very good among 27.2% of adults with a disability compared with 60.2% of adults without a disability.
- Reports of fair or poor health among adults with a disability by race and ethnicity were:
- Hispanic, 55.2%
- American Indian or Alaska Native, 50.5%
- Non-Hispanic Black or African American, 46.6%
- Non-Hispanic White, 36.9%
- Native Hawaiian or Other Pacific Islander, 36.5%
- Asian, 24.9%

Contact Us:
- Centers for Disease Control and Prevention
National Center on Birth Defects and Developmental Disabilities
Division of Human Development and Disability
1600 Clifton Road
MS E-88
Atlanta, GA 30333 - 800-CDC-INFO
(800-232-4636)
TTY: (888) 232-6348
New Hours of Operation
8am-8pm ET/Monday-Friday
Closed Holidays - cdcinfo@cdc.gov
