All Vision Impairment
Vision Impairment Defined
Vision impairment is defined as the best-corrected visual acuity less than 6/12 (‹20/40) in the better-seeing eye (excluding those who were categorized as being blind by the U.S. definition.)
The category "All Vision Impairment" includes both low vision and blindness.
On this page:
- 2010 U.S. age-specific prevalence rates for Vision Impairment by Age, and Race/Ethnicity
- 2010 Prevalence Rates of Vision Impairment by Race
- 2010 U.S. Prevalent Cases of Vision Impairment (in thousands) by Age, and Race/Ethnicity
- 2010 U.S. Prevalent Cases of Vision Impairment (in thousands) by Age, Gender, and Race/Ethnicity
- Projections for Vision Impairment (2010-2030-2050)
- Changes of Cases between 2000 and 2010
- 2000 U.S. Prevalent Cases of Vision Impairment (in thousands) by Age, and Race/Ethnicity
- 2000 U.S. Prevalent Cases of Vision Impairment (in thousands) by Age, Gender, and Race/Ethnicity
2010 U.S. Age-Specific Prevalence Rates for Vision Impairment by Age and Race/Ethnicity
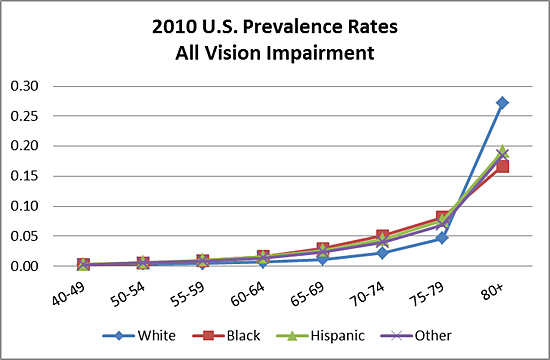
| Age | White | Black | Hispanic | Other | All |
|---|---|---|---|---|---|
| 40-49 | 0.32% | 0.23% | 0.33% | 0.28% | 0.31% |
| 50-54 | 0.36% | 0.51% | 0.62% | 0.54% | 0.42% |
| 55-59 | 0.46% | 0.92% | 0.99% | 0.86% | 0.59% |
| 60-64 | 0.68% | 1.65% | 1.60% | 1.40% | 0.89% |
| 65-69 | 1.14% | 2.96% | 2.64% | 2.36% | 1.49% |
| 70-74 | 2.17% | 5.06% | 4.46% | 4.01% | 2.70% |
| 75-79 | 4.65% | 8.20% | 7.61% | 6.92% | 5.25% |
| 80+ | 27.17% | 16.68% | 19.11% | 18.44% | 25.66% |
| TOTAL | 3.27% | 2.18% | 1.95% | 2.02% | 2.94% |
2010 Prevalence Rates of Vision Impairment by Race
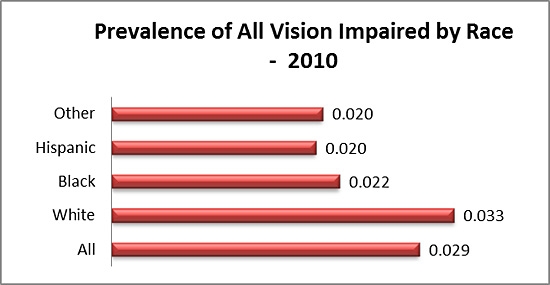
| All | White | Black | Hispanic | Other | |
|---|---|---|---|---|---|
| Prevalence | 0.029 | 0.033 | 0.022 | 0.020 | 0.020 |
2010 U.S. Prevalent Cases of Vision Impairment (in thousands) by Age, and Race/Ethnicity
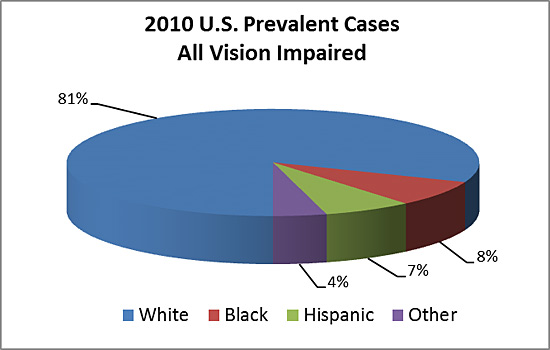
| Age | White | Black | Hispanic | Other | All |
|---|---|---|---|---|---|
| 40-49 | 92 | 12 | 22 | 9 | 135 |
| 50-54 | 56 | 13 | 16 | 8 | 93 |
| 55-59 | 67 | 20 | 18 | 11 | 116 |
| 60-64 | 87 | 27 | 22 | 13 | 149 |
| 65-69 | 111 | 34 | 25 | 15 | 185 |
| 70-74 | 157 | 43 | 32 | 20 | 252 |
| 75-79 | 272 | 50 | 39 | 24 | 385 |
| 80+ | 2,556 | 133 | 119 | 76 | 2,884 |
| TOTAL | 3,398 | 332 | 293 | 176 | 4,199 |
2010 U.S. Prevalent Cases of Vision Impairment (in thousands) by Age, Gender, and Race/Ethnicity
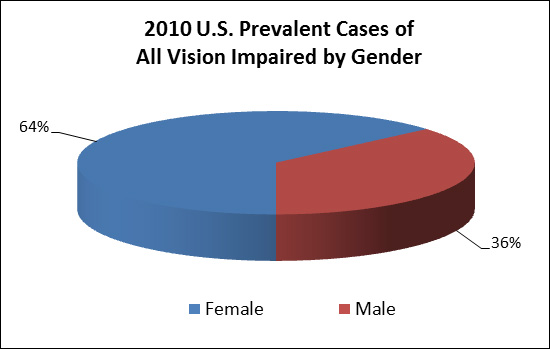
| Female/Age | White | Black | Hispanic | Other | All |
|---|---|---|---|---|---|
| 40-49 | 46 | 6 | 11 | 5 | 68 |
| 50-54 | 28 | 7 | 8 | 4 | 47 |
| 55-59 | 34 | 11 | 9 | 6 | 60 |
| 60-64 | 45 | 15 | 12 | 7 | 79 |
| 65-69 | 58 | 19 | 14 | 8 | 99 |
| 70-74 | 84 | 25 | 18 | 11 | 138 |
| 75-79 | 152 | 31 | 23 | 14 | 220 |
| 80+ | 1,747 | 93 | 76 | 48 | 1,964 |
| TOTAL | 2,194 | 207 | 171 | 103 | 2,675 |
| Male/Age | White | Black | Hispanic | Other | All |
|---|---|---|---|---|---|
| 40-49 | 46 | 6 | 11 | 4 | 67 |
| 50-54 | 28 | 6 | 8 | 4 | 46 |
| 55-59 | 33 | 9 | 9 | 5 | 56 |
| 60-64 | 42 | 12 | 10 | 6 | 70 |
| 65-69 | 53 | 15 | 11 | 7 | 86 |
| 70-74 | 73 | 18 | 14 | 9 | 114 |
| 75-79 | 120 | 19 | 16 | 10 | 165 |
| 80+ | 809 | 40 | 43 | 28 | 920 |
| TOTAL | 1,204 | 125 | 122 | 73 | 1,524 |
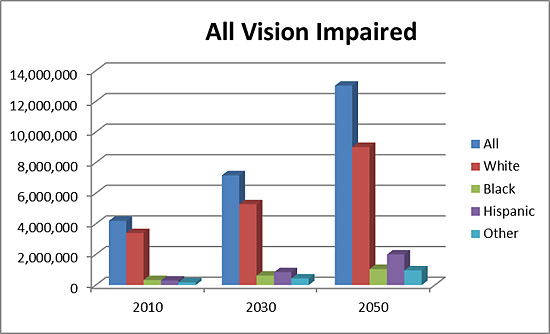
Projections for Vision Impairment (2010-2030-2050)
| Year | All | White | Black | Hispanic | Other |
|---|---|---|---|---|---|
| 2010 | 4,195,966 | 3,398,977 | 330,644 | 290,781 | 175,564 |
| 2030 | 7,169,680 | 5,277,689 | 618,110 | 840,497 | 433,383 |
| 2050 | 13,026,870 | 9,019,189 | 1,047,986 | 2,000,853 | 958,842 |
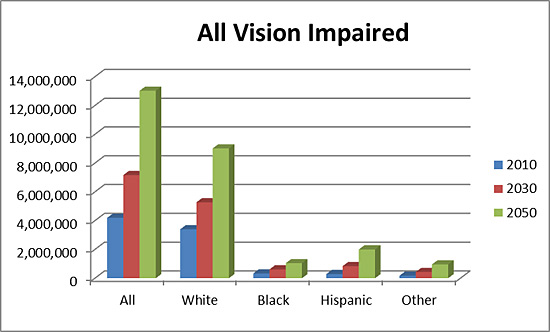
| Total Population | 142,648,393 | 103,846,437 | 15,190,777 | 14,901,369 | 8,709,810 |
|---|
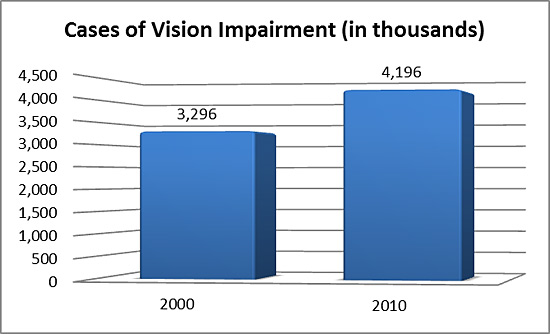
Changes of Cases between 2000 and 2010
| Year | Value | Short Value |
|---|---|---|
| 2000 | 3,295,670 | 3,296 |
| 2010 | 4,195,966 | 4,196 |
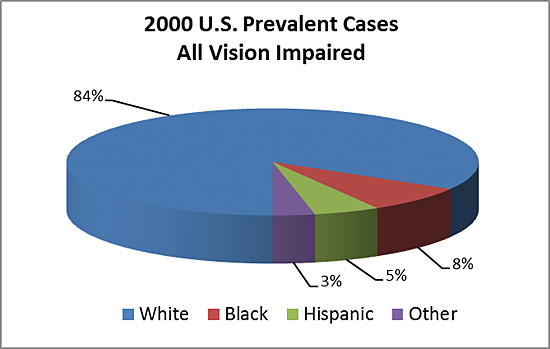
2000 U.S. Prevalent Cases of Vision Impairment (in thousands) by Age, and Race/Ethnicity
| Age | White | Black | Hispanic | Other | All |
|---|---|---|---|---|---|
| 40-49 | 100 | 11 | 14 | 7 | 132 |
| 50-54 | 48 | 9 | 8 | 5 | 70 |
| 55-59 | 49 | 12 | 10 | 6 | 77 |
| 60-64 | 58 | 18 | 12 | 7 | 95 |
| 65-69 | 88 | 26 | 16 | 9 | 139 |
| 70-74 | 160 | 37 | 21 | 14 | 232 |
| 75-79 | 288 | 45 | 24 | 16 | 373 |
| 80+ | 1,960 | 109 | 65 | 45 | 2,179 |
| TOTAL | 2,751 | 267 | 170 | 109 | 3,297 |
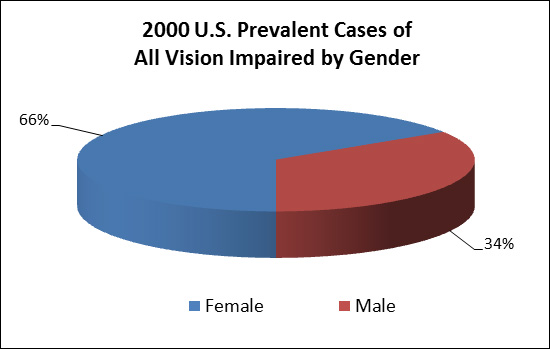
2000 U.S. Prevalent Cases of Vision Impairment (in thousands) by Age, Gender, and Race/Ethnicity
| Female/Age | White | Black | Hispanic | Other | All |
|---|---|---|---|---|---|
| 40-49 | 50 | 6 | 7 | 4 | 67 |
| 50-54 | 24 | 5 | 4 | 3 | 36 |
| 55-59 | 25 | 7 | 5 | 3 | 40 |
| 60-64 | 30 | 10 | 6 | 4 | 50 |
| 65-69 | 47 | 15 | 9 | 5 | 76 |
| 70-74 | 89 | 22 | 12 | 8 | 131 |
| 75-79 | 170 | 28 | 14 | 9 | 221 |
| 80+ | 1,405 | 77 | 43 | 28 | 1,553 |
| TOTAL | 1,840 | 170 | 100 | 64 | 2,174 |
| Male/Age | White | Black | Hispanic | Other | All |
|---|---|---|---|---|---|
| 40-49 | 50 | 5 | 7 | 3 | 65 |
| 50-54 | 24 | 4 | 4 | 2 | 34 |
| 55-59 | 24 | 5 | 5 | 3 | 37 |
| 60-64 | 28 | 8 | 6 | 3 | 45 |
| 65-69 | 41 | 11 | 7 | 4 | 63 |
| 70-74 | 71 | 15 | 9 | 6 | 101 |
| 75-79 | 118 | 17 | 10 | 7 | 152 |
| 80+ | 555 | 32 | 22 | 17 | 626 |
| TOTAL | 911 | 97 | 70 | 45 | 1,123 |

