U.S. Economy at a Glance: Perspective from the BEA Accounts
BEA produces some of the most closely watched economic statistics that influence decisions of government officials, business people, and individuals. These statistics provide a comprehensive, up-to-date picture of the U.S. economy. The data on this page are drawn from featured BEA economic accounts.
National Economic Accounts:
Gross Domestic Product (GDP)
Current Numbers:
- 4th quarter 2012: -0.1 percent
- 3rd quarter 2012: 3.1 percent
Quarterly data:
Real gross domestic product -- the output of goods and services produced by labor and property located in the United States -- decreased at an annual rate of 0.1 percent in the fourth quarter of 2012 (that is, from the third quarter to the fourth quarter), according to the "advance" estimate released by the Bureau of Economic Analysis. In the third quarter, real GDP increased 3.1 percent.
Next release:
February 28, 2013

Personal Income
Current Numbers:
- December 2012: 2.6 percent (personal income)
- November 2012: 1.0 percent (personal income)
Next release:
March 1, 2013
Monthly data:
In December 2012, real disposable personal income increased 2.8 percent.
Industry Economic Accounts:
Annual Industry Accounts: GDP by Industry
Annual Data:
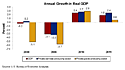
Retail trade and durable goods manufacturing were the leading contributors to the deceleration in U.S. economic growth in 2011, according to revised statistics on the breakout of real gross domestic product (GDP) by industry from the Bureau of Economic Analysis. Real GDP growth slowed in 2011, increasing 1.8 percent after increasing 2.4 percent in 2010. The revised statistics do not change the general picture of the economy: 12 of 22 industry groups contributed to the slowdown in real GDP.
Annual Growth in Real GDP
View Larger Image
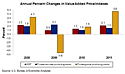
Annual Percent Changes in Value Added Prices
View Larger Image
View Larger Image
Annual Percent Changes in Value Added Prices
View Larger Image
International Economic Accounts:
U.S. Balance of Payments (International Transactions)
Current Account Balance:
- 3rd quarter 2012: -$107.5 billion
- 2nd quarter 2012: -$118.1 billion
Next release:
March 14, 2013
Quarterly
data:
The U.S. current-account deficit decreased $10.6 billion to $107.5 billion (preliminary) in the third quarter of 2012.
International Investment Position
Annual data:
The U.S. net international investment position at yearend 2011 was -$4,030.3 billion (preliminary), as the value of foreign investment in the United States exceeded the value of U.S. investment abroad.
International Trade in Goods and Services
Trade Balance:
- December 2012: -$38.5 billion
- November 2012: -$48.6 billion
Next release:
March 7, 2013
Monthly:
Total December exports of $186.4 billion and imports of $224.9 billion resulted in a goods and services deficit of $38.5 billion.
Regional Economic Accounts:
Gross Domestic Product (GDP) by State
Next release:
June 2013
Annual Data:
Real gross domestic product (GDP) increased in 43 states and the District of Columbia in 2011, according to new statistics released today by the U.S. Bureau of Economic Analysis (BEA) that breakdown GDP by state. Durable-goods manufacturing, professional, scientific, and technical services, and information services were the leading contributors to real U.S. economic growth. U.S. real GDP by state grew 1.5 percent in 2011 after a 3.1 percent increase in 2010.

Gross Domestic Product (GDP) by Metropolitan Area
Annual data:
Real U.S. GDP by metropolitan area increased 2.5 percent in 2010 after declining 2.5 percent in 2009, according to new statistics released today by the U.S. Bureau of Economic Analysis. The economic growth was widespread as real GDP increased in 304 of 366 (83 percent) metropolitan areas, led by national growth in durable-goods manufacturing, trade, and financial activities.

State Personal Income (SPI)
Next release:
March 27, 2013
Quarterly data:
State personal income growth slowed to 0.5 percent in the third quarter of 2012, from 0.7 percent in the second quarter.

Local Area Personal Income
Metropolitan area data:
Personal income rose in 2011 in all of the nation's 366 metropolitan statistical areas (MSAs) for the first time since 2007. Personal income growth ranged from 14.8 percent in Odessa, Texas to 1.0 percent in Rochester, Minnesota.
County data:
Personal income rose in 3,062 of the nation's 3,113 counties in 2011, with growth ranging from 62.2 percent in King County, Texas to -28.8 percent in Lynn County, Texas.
Annual data: