Nature | Article Open
Analysis of the bread wheat genome using whole-genome shotgun sequencing
- Journal name:
- Nature
- Volume:
- 491,
- Pages:
- 705–710
- Date published:
- (29 November 2012)
- DOI:
- doi:10.1038/nature11650
- Received
- Accepted
- Published online
Abstract
Bread wheat (Triticum aestivum) is a globally important crop, accounting for 20 per cent of the calories consumed by humans. Major efforts are underway worldwide to increase wheat production by extending genetic diversity and analysing key traits, and genomic resources can accelerate progress. But so far the very large size and polyploid complexity of the bread wheat genome have been substantial barriers to genome analysis. Here we report the sequencing of its large, 17-gigabase-pair, hexaploid genome using 454 pyrosequencing, and comparison of this with the sequences of diploid ancestral and progenitor genomes. We identified between 94,000 and 96,000 genes, and assigned two-thirds to the three component genomes (A, B and D) of hexaploid wheat. High-resolution synteny maps identified many small disruptions to conserved gene order. We show that the hexaploid genome is highly dynamic, with significant loss of gene family members on polyploidization and domestication, and an abundance of gene fragments. Several classes of genes involved in energy harvesting, metabolism and growth are among expanded gene families that could be associated with crop productivity. Our analyses, coupled with the identification of extensive genetic variation, provide a resource for accelerating gene discovery and improving this major crop.
Subject terms:
At a glance
-
Figure 1: Coverage of OGRs by wheat 454 sequence reads and simulated 454 reads from rice and maize. ![Coverage of OGRs by wheat 454[thinsp]sequence reads and simulated 454[thinsp]reads from rice and maize.](https://cybercemetery.unt.edu/archive/oilspill/20130312152734im_/http://www.nature.com/nature/journal/v491/n7426/carousel/nature11650-f1.2.jpg)
a, Coverage of OGRs by repeat-masked wheat 454 sequence reads (black line), wheat LCG (black dashed line) and the orthologous group assembly (blue line), together with rice genes (red line) and maize simulated reads (green line). b, Median coverage depth over protein-coding regions of OGRs (amino terminus = 0; carboxy terminus = 100). The colour coding is the same as in a, except simulated hexaploid reads from rice (red line) were used. c, Distribution of wheat gene copy numbers from the orthologous group assembly.
-
Figure 2: Alignment of wheat 454 reads, SNPs and genetic maps to the B. distachyon genome. ![Alignment of wheat 454[thinsp]reads, SNPs and genetic maps to the B.[thinsp]distachyon genome.](https://cybercemetery.unt.edu/archive/oilspill/20130312152734im_/http://www.nature.com/nature/journal/v491/n7426/carousel/nature11650-f2.2.jpg)
The inner circle represent gene order on the five Brachypodium chromosomes (Bd1–Bd5). Track 1 illustrates conservation between wheat 454 reads and Brachypodium genes, shown as a window of genes present in wheat. Tracks 2–4 show SNP density (the mean number of SNPs per gene in a window of 20 genes) in the A (track 2), B (track 3) and D (track 4) genomes of wheat. Tracks 5–7 show wheat synteny with Brachypodium for the A (track 5), B (track 6) and D (track 7) genomes. Genetic markers25 (shown in darker colours) are colour-coded by wheat chromosome. Gaps between markers are filled in to show synteny (lighter colours).
-
Figure 3: Gene family sizes in orthologous assemblies of hexaploid wheat, Ae. tauschii, simulated maize and hexaploid rice. ![Gene family sizes in orthologous assemblies of hexaploid wheat, Ae.[thinsp]tauschii, simulated maize and hexaploid rice.](https://cybercemetery.unt.edu/archive/oilspill/20130312152734im_/http://www.nature.com/nature/journal/v491/n7426/carousel/nature11650-f3.2.jpg)
The boxes and whiskers contain 50% and 90% of the orthologous group assembly genes, respectively. The box colours indicate the number of genes in diploid gene families of different sizes. The black lines represent expected gene family sizes, and the red lines show the gene family sizes determined from the orthologous group assembly, derived by polynomial regression fit. Only gene families with up to ten members are shown. a, Maize gene family sizes predicted from orthologous assembly of simulated 454 reads. b, Rice gene family sizes predicted from orthologous assembly of simulated 454 reads derived from triplicated rice genes. c, Aegilops tauschii gene family sizes obtained from orthologous assembly of repeat-masked 454 reads. Expanded gene families are shown as green dots. d, Wheat gene family sizes in the orthologous group assembly. e, Amalgamation of wheat and Ae. tauschii gene copy numbers. The black line shows the respective expected gene copy numbers for wheat and Ae. tauschii. The red line shows the regression fit for wheat, and the blue line shows the regression fit for Ae. tauschii. The grey zone between these lines estimates the extent of gene loss in hexaploid wheat. For each family size, the left-hand boxes represent hexaploid wheat and the right-hand boxes represent Ae. tauschii.
-
Figure 4: Pseudogene identification and analysis. 
a, Visualization of an OGR and associated wheat sequences. The top track shows the hit count profile of mapped 454 reads. The lower tracks show subassemblies of three wheat genes and a stacked region of gene fragments. Read depth is represented by the heat map. b, Coverage of the OGR by Pfam-containing gene fragments and pseudogenes. The blue and red lines represent stacks with and without protein domains, respectively. c. Protein identity between subassemblies forming stacks of gene fragments. The blue and red lines represent stacks with and without protein domains, respectively, and the black line represents subassemblies forming genes.
Sequence assembly
An orthologous group assembly (Supplementary Table 3) was created by clustering 454 reads by sequence similarity to orthologous grass gene sequences, and separate assembly of the clusters at high stringency using Newbler (Supplementary Information, section 2). The orthologous genes were derived from rice16, sorghum8, Brachypodium9 and barley full-length cDNAs by OrthoMCL17 clustering. This generated 20,496 orthologous groups (Supplementary Table 4 and Supplementary Fig. 1). The gene model with highest similarity to wheat (termed the orthologous group representative (OGR)) was selected from each orthologous group by stringent BLASTX comparison to a low-copy-number genome assembly (LCG) made by filtering out repetitive sequences and assembling the remaining low-copy-number sequences de novo (Supplementary Table 3). The assemblies are described in Table 2. Nearly 90% of the metabolic genes in Arabidopsis matched OGRs, and the 20,051 OGRs matched 92% of publicly available wheat full-length cDNAs18 and 78.7% of the harvEST set of wheat cDNA assemblies (Supplementary Fig. 2), indicating that they represent nearly all wheat genes.
We optimized parameters for wheat gene assembly using MetaSim19 to generate simulated fivefold 454 reads from the allotetraploid maize genome and from a triplicated rice gene set, with the introduction of sequence variation (Supplementary Information, section 2.7). Similar degrees of coverage over the OGRs were seen for the simulated data sets and wheat 454 reads (Fig. 1a). Rice reads followed the same depth distribution as the wheat reads (Fig. 1b), suggesting that they are a reasonable representation of hexaploid sequences. Maize reads covered their OGRs to a median depth of approximately five, consistent with fivefold coverage.
![Coverage of OGRs by wheat 454[thinsp]sequence reads and simulated 454[thinsp]reads from rice and maize.](https://cybercemetery.unt.edu/archive/oilspill/20130312152734im_/http://www.nature.com/nature/journal/v491/n7426/images_article/nature11650-f1.2.jpg)
a, Coverage of OGRs by repeat-masked wheat 454 sequence reads (black line), wheat LCG (black dashed line) and the orthologous group assembly (blue line), together with rice genes (red line) and maize simulated reads (green line). b, Median coverage depth over protein-coding regions of OGRs (amino terminus = 0; carboxy terminus = 100). The colour coding is the same as in a, except simulated hexaploid reads from rice (red line) were used. c, Distribution of wheat gene copy numbers from the orthologous group assembly.
Simulated maize and triplicated rice 454 reads were used to optimize assembly parameters. Assembly at 99% minimum sequence identity (m.i.) using 40-bp overlap length predicted gene family sizes most accurately (Supplementary Figs 3–6). Wheat 454 reads were preprocessed (Supplementary Table 5) and assembled using 99% m.i. (Supplementary Tables 6 and 7) to create the orthologous group assembly. Figure 1b shows that the depth of coverage of the orthologous group assembly followed a similar pattern to maize, consistent with multiple gene copies. In contrast, the low depth coverage by the LCG assembly suggested that gene family numbers were collapsed. The number of wheat assemblies for each OGR was calculated to determine gene copy numbers (Supplementary Table 7). Figure 1c shows that most OGRs had between one and five distinctive wheat gene assemblies, with a peak of two genes.
The A, B and Ae. tauschii (D) genomes13, 20, 21 have been estimated to contain approximately 28,000, 38,000 and 36,000 genes, respectively. We estimated the number of genes in the hexaploid wheat genome to range between 94,000 and 96,000 (Supplementary Information, section 2.10). This is reasonably consistent with estimates based on wheat chromosome sequences13. Comparing our transcriptome assembly (Supplementary Information, sections 2.8 and 2.9) and wheat harvEST with the wheat OGRs showed that 76% and, respectively, 65% were expressed under the conditions used for RNA isolation. Similar results were found in barley22, rice16 and maize23, indicating that the assemblies are bona fide wheat genes.
We defined the overall extent of gene conservation between wheat and the most closely related sequenced pooid grass, Brachypodium distachyon9, 24. Track 1 of Fig. 2 shows that there is a high degree of overlap between the gene sets of Brachypodium and wheat, but with regions of lower conservation, for example on Brachypodium chromosomes 1 and 4. Syntenic maps of the Brachypodium genome and the A-, B- and D-chromosome groups were created by integrating high-density wheat EST-based markers25 with Brachypodium genes (Fig. 2, tracks 5, 6 and 7, respectively). Supplementary Fig. 7 shows the A-, B- and D-genome markers separately. Syntenic alignments were readily identifiable and conformed to the predicted major patterns9, 26. We identified many insertions and/or translocations of blocks of genes within the overall conserved patterns of gene order, including the major rearrangement on chromosome 4A as shown on Brachypodium chromosome 1 (ref. 20). Lower marker density on the D genome is evident in track 7. The higher-resolution genetic map identified a new syntenic alignment of Triticeae group 5 to Brachypodium chromosome 3 genes.
![Alignment of wheat 454[thinsp]reads, SNPs and genetic maps to the B.[thinsp]distachyon genome.](https://cybercemetery.unt.edu/archive/oilspill/20130312152734im_/http://www.nature.com/nature/journal/v491/n7426/images_article/nature11650-f2.2.jpg)
The inner circle represent gene order on the five Brachypodium chromosomes (Bd1–Bd5). Track 1 illustrates conservation between wheat 454 reads and Brachypodium genes, shown as a window of genes present in wheat. Tracks 2–4 show SNP density (the mean number of SNPs per gene in a window of 20 genes) in the A (track 2), B (track 3) and D (track 4) genomes of wheat. Tracks 5–7 show wheat synteny with Brachypodium for the A (track 5), B (track 6) and D (track 7) genomes. Genetic markers25 (shown in darker colours) are colour-coded by wheat chromosome. Gaps between markers are filled in to show synteny (lighter colours).
Genome change in polyploid wheat
We determined the influence of polyploidy on gene content in hexaploid wheat by defining the sizes of gene families in hexaploid wheat and the diploid progenitor Ae. tauschii from the copy number of genes for each OGR, which were then paired with the gene family size of the OGR in sequenced diploid grasses (Supplementary Information, section 2.6). The mean family size was 1.4 members. Supplementary Fig. 8 shows relationships between wheat and diploid orthologous gene family across the full scale of orthologous gene family sizes. This approach accurately reconstructed gene family sizes in simulated maize and ‘hexaploid’ rice genomes (Figs 3a, b), although larger gene family sizes tended to be underestimated. Figure 3c, d shows the relationships between Ae. tauschii and wheat genes. Single-member gene families in hexaploid wheat and Ae. tauschii were maintained to a similar extent as those seen in sequenced diploid grasses, consistent with Southern blot analyses of single-copy genes27. Using the D genome as a diploid reference, we calculated the Triticeae hexaploid/diploid gene family size ratio to be between 2.5:1 and 2.7:1, derived from the geometric mean (2.5:1) and the slopes of the blue line and the red line (2.7:1) in Fig. 3e. Comparing this with the expected hexaploid/diploid ratio of 3:1 indicates the loss of between 10,000 and 16,000 genes in hexaploid wheat compared with the three diploid progenitors (Supplementary Information, section 2.10). This is consistent with earlier studies of gene loss in newly synthesized wheat polyploids28 and the erosion of genetic diversity during wheat domestication6.
![Gene family sizes in orthologous assemblies of hexaploid wheat, Ae.[thinsp]tauschii, simulated maize and hexaploid rice.](https://cybercemetery.unt.edu/archive/oilspill/20130312152734im_/http://www.nature.com/nature/journal/v491/n7426/images_article/nature11650-f3.2.jpg)
The boxes and whiskers contain 50% and 90% of the orthologous group assembly genes, respectively. The box colours indicate the number of genes in diploid gene families of different sizes. The black lines represent expected gene family sizes, and the red lines show the gene family sizes determined from the orthologous group assembly, derived by polynomial regression fit. Only gene families with up to ten members are shown. a, Maize gene family sizes predicted from orthologous assembly of simulated 454 reads. b, Rice gene family sizes predicted from orthologous assembly of simulated 454 reads derived from triplicated rice genes. c, Aegilops tauschii gene family sizes obtained from orthologous assembly of repeat-masked 454 reads. Expanded gene families are shown as green dots. d, Wheat gene family sizes in the orthologous group assembly. e, Amalgamation of wheat and Ae. tauschii gene copy numbers. The black line shows the respective expected gene copy numbers for wheat and Ae. tauschii. The red line shows the regression fit for wheat, and the blue line shows the regression fit for Ae. tauschii. The grey zone between these lines estimates the extent of gene loss in hexaploid wheat. For each family size, the left-hand boxes represent hexaploid wheat and the right-hand boxes represent Ae. tauschii.
Despite this overall trend of gene family size reduction, gene families with fewer or more members than expected were identified in Ae. tauschii and hexaploid wheat, as shown by green dots (more members) and brown dots (fewer members) in Fig. 3c (Ae. tauschii) and Fig. 3d (hexaploid wheat). Supplementary Tables 10–12 show the over- and under-represented functional categories of protein. Most of the over-represented categories in expanded gene families are common to wheat and Ae. tauschii: these include ribosome proteins, components of photosystem II, storage proteins, transposon-related proteins, cytochrome P450s, NB-ARC domain proteins involved in defence responses, proteins related to pollen allergens and F-box proteins. Five of the eleven families encoding hydrogen ion transmembrane transporters were significantly more numerous in Ae. tauschii than in wheat. Analysis of gene families (Supplementary Fig. 9) showed that they encode different subunits of ATPases. We speculate that they may provide proton gradients to support Na+ exclusion in Ae. tauschii29 and the accumulation of minerals in other Aegilops species30.
Pseudogene analysis
Several classes of plant DNA transposons31, 32 and retroelements33 create and amplify gene fragments, disrupt genes and create pseudogenes, which can influence gene expression through epigenetic mechanisms34. We identified a set of almost 233,000 gene fragments that mapped to the same regions of their OGRs, forming ‘stacks’ that were sufficiently divergent not to assemble into their cognate gene assemblies (Fig. 4a). Two classes were identified: those containing Pfam domains and those aligning with non-Pfam domains of OGRs. Nearly 30% of the OGRs had associated gene fragments (Supplementary Table 13) that most frequently covered between 5 and 15% of the OGR length (Fig. 4b). Figure 4c shows that the alignment identities of gene fragments against their OGRs were substantially lower than the identities of cognate regions within wheat gene assemblies. Supplementary Fig. 10 shows the distribution of stacks along genes and the ratio of non-synonymous to synonymous substitutions (Ka/Ks) along the genes. Pfam domains found in stacks were enriched for zinc-finger motifs in mutator transposons (Supplementary Table 14), consistent with their role in pseudogene formation31. F-box, protein kinase and NB-ARC domains, which are found in the most rapidly evolving gene families in plants9, 35, are also over-represented.
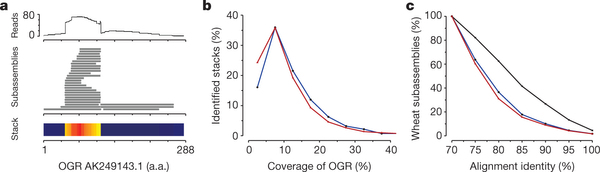
a, Visualization of an OGR and associated wheat sequences. The top track shows the hit count profile of mapped 454 reads. The lower tracks show subassemblies of three wheat genes and a stacked region of gene fragments. Read depth is represented by the heat map. b, Coverage of the OGR by Pfam-containing gene fragments and pseudogenes. The blue and red lines represent stacks with and without protein domains, respectively. c. Protein identity between subassemblies forming stacks of gene fragments. The blue and red lines represent stacks with and without protein domains, respectively, and the black line represents subassemblies forming genes.
