Mammoth Cave National Park: Air Quality 10-day Charts
Ozone, Particulate Matter (PM2.5), Visibility, Sulfur Dioxide (SO2), Carbon Monoxide, Nitrogen Oxide, and Total Reactive Oxides of NitrogenCollected at the Houchin Meadow Monitoring Site
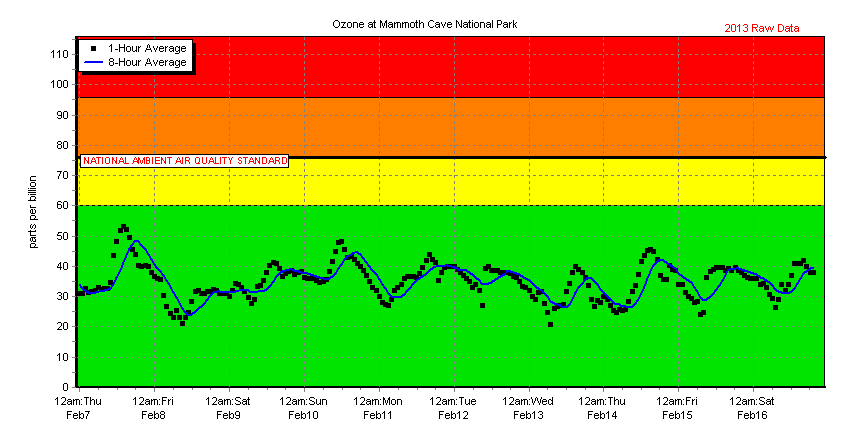
Ozone: 1-hour and 8-hour average concentrations
The chart below plots both the 1-hour and running 8-hour average ozone concentration, but only the 8-hour average should be used to compare with the standard. The standard is exceeded when the 8-hour concentrations reach or go above 75 parts per billion, as denoted by the line with the label NAT'L AMBIENT AIR QUALITY STANDARD. The background of the chart is color coded and relates to the EPA National Ambient Air Quality Standard for ozone, which is designed to protect human health.
Understanding Ozone »
Levels of Public Health Concern for 8-hr Average Ozone »
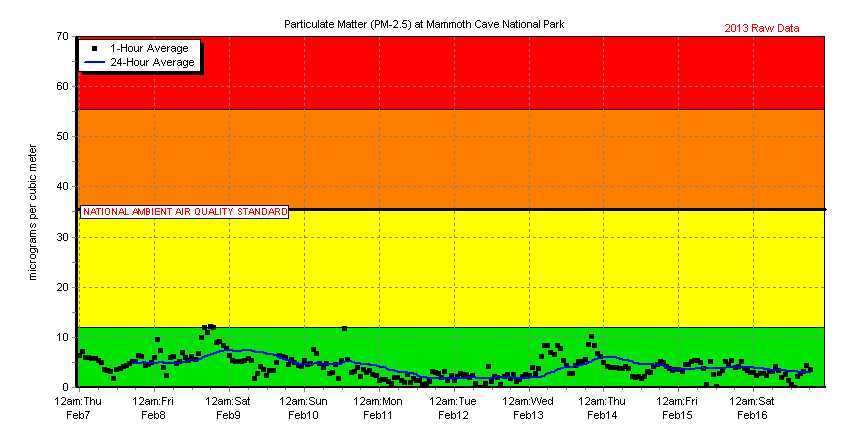
Particulate Matter Less Than 2.5 Micrometers in Diameter (PM2.5): 1-hour and 24-hour average concentrations
The chart below plots both the 1-hour and running 24-hour average PM2.5 concentration, but only the 24-hour average should be used to compare with the standard. The standard is exceeded when the 24-hour concentrations go above 35 micrograms per cubic meter, as denoted by the line with the label NAT'L AMBIENT AIR QUALITY STANDARD. The background of the chart is color coded and relates to the EPA National Ambient Air Quality Standard for particulate matter, which is designed to protect human health.
Understanding Particulate Matter »
Levels of Public Health Concern for 24-hr Average PM 2.5 »
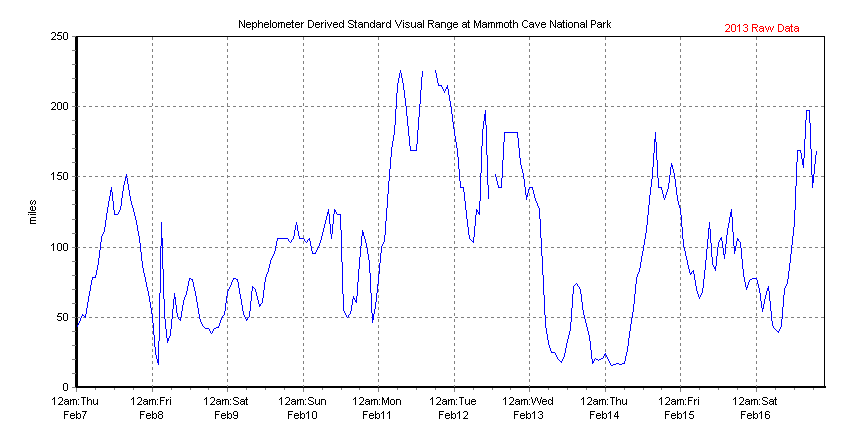
Visibility: Standard Visual Range
Visual range is one measure of visibility and is defined as the greatest distance at which a large black object can be seen and recognized against the background sky. It is not directly measured but rather calculated from a measurement of light extinction, which includes the scattering and absorption of light by particles and gases. Extinction is monitored with transmissometers or nephelometers, or reconstructed from measurements of particle mass and chemical composition.
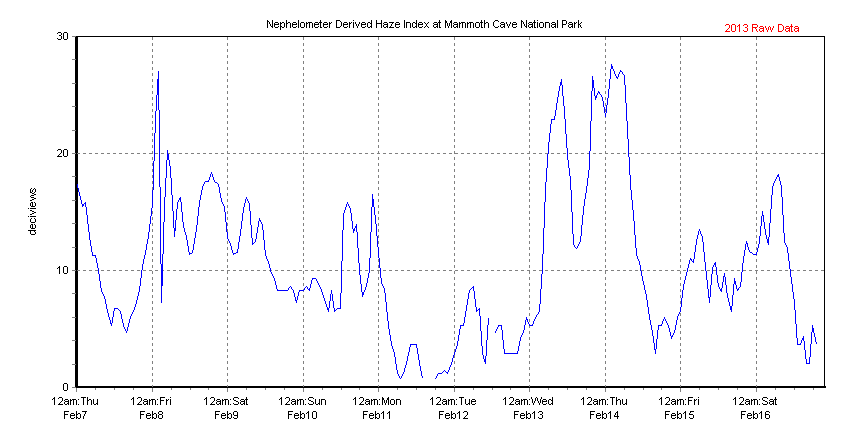
Visibility: Haze Index
Haze Index, expressed in deciviews (dv), is derived from light extinction measurements. Unlike visual range, the deciview scale is near zero for a pristine clean atmosphere and increases as visibility degrades.
