Only one measure per topic is displayed in the summary table. A complete set of measures, where they exist, can be found in the report.
| |
Fruit and vegetable consumption
1994–2004 |
Red meat consumption
1994–2004 |
Fat consumption
1989–2008 |
Alcohol consumption
1990–2009 |
| Measure |
Average daily cups of fruits and vegetables for people ages 2 and older. This measure includes fruits and vegetables from all sources. |
Average daily ounce equivalents of red meat for people aged 2 years and older. Red meat includes beef, lamb, and pork from all sources and does not include processed poultry. |
Intakes of total fat, and of the major fatty acids - saturated, monounsaturated, and polyunsaturated - as a percentage of total calories. |
Per capita alcohol consumption: The estimated number of gallons of pure alcohol consumed per person (aged 14 years and older), per year. This measure accounts for the varying alcohol content of wine, beer, and liquor. People as young as 14 are included because a large number of adolescents begin drinking at an early age. |
| Recent summary trend* |
Non-significant change
2000–2004 |
Non-significant change
2000–2004 |
Rising
2004–2008 |
Rising
2005–2009 |
| Desired direction |
Rising  |
Rising |
Falling  |
Falling |
| Trend details |
Stable, then falling, then stable, then non-significant change
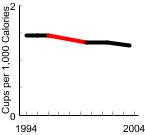
|
Stable, then
non-significant change, then stable

|
Falling, then rising

|
Falling, then rising

|
| Most recent estimate |
From 2001 to 2004, people aged 2 years and older consumed, on average, 0.5 cup equivalents of fruits per 1,000 calories and 0.8 cup equivalents of vegetables per 1,000 calories (including 0.1 cup equivalents of dark green and orange vegetables and legumes per 1,000 calories). |
In 2003 to 2004, people aged 2 years and older had, on average, consumed 1.1 ounce equivalents of red meat per 1,000 calories. |
Data collected in 2007 to 2008 show that total fat made up one-third (33 percent) of the calories people consumed, a level within the recommendations of the Dietary Guidelines. In the same period, saturated fatty acids accounted for 11 percent of calories, monounsaturated, 12 percent, and polyunsaturated, 7 percent. |
In 2009, per capita alcohol consumption was 2.3 gallons for all beverages, including beer, wine, and liquor. |
| Healthy People 2020 target |
0.9 cup equivalents of fruits per 1,000 calories. 1.1 cup equivalents of vegetables per 1,000 calories, with at least 0.3 cup equivalents of dark green or orange vegetables or legumes per 1,000 calories. |
There is no Healthy People target for red meat consumption. |
9.5 percent saturated fatty acids. (Healthy People 2020 includes targets for saturated fat and solid fat.) |
Reduce annual per capita alcohol consumption to 2 gallons. |
| More information |
Fruit and Vegetable Consumption |
Red Meat Consumption |
Fat Consumption |
Alcohol Consumption |