
Cancer Control and Population Sciences Home
Joinpoint:

Comparability Test
The main goal of the comparability test is to compare two sets of trend data whose mean functions are represented by joinpoint regression. Specific interests are on testing:
- whether two Joinpoint regression functions are identical (test of coincidence) or
- whether the two regression mean functions are parallel (test of parallelism)
and the details can be found in Kim et al. (2004):
H.-J. Kim, M. P. Fay, B. Yu, M. J. Barrett and E. J. Feuer (2004), Comparability of Segmented Line Regression Models, Biometrics, 1005-1014.
Consider the Joinpoint regression mean function at the jth year of the ith group, x = xij ,
where κ is the unknown number of joinpoints, the τ's are the unknown joinpoints, the β's and the δ's are the regression coefficients. In general, the two groups may have different numbers of joinpoints, say κi for the ith group, but the program fits both groups with a larger model with kmax joinpoints.
What are the hypotheses?
The null hypotheses for the test of coincidence and the test of parallelism are
and
respectively.
What is the test statistic?
The test statistic with k = kmax is
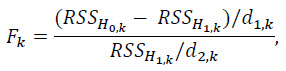
where RSS denotes the residual sum of squares obtained from the least squares fitting, and d1 and d2 are appropriate degrees of freedom.
How is the kmax chosen?
The recommended data driven choice of kmax is the largest number of joinpoints estimated under the null and alternative models:
where ![]() is the number of joinpoints estimated for the two groups combined under the null model, and
is the number of joinpoints estimated for the two groups combined under the null model, and ![]() and
and ![]() are the numbers of Joinpoints estimated separately.
are the numbers of Joinpoints estimated separately.
How is the p-value estimated?
The P-value of the test is estimated using the permutation distribution of the test statistic. The residuals, obtained under the null model, are permuted to generate the permutation distribution of the test statistic and the P-value is estimated as the proportion of the permutation data sets whose test statistic values are greater than the original test statistic value.