NOAA Office of Satellite and Product Operations

Hazard Products


Coral Bleaching Operational Products
Bleaching Alert Area
Coral Bleaching Virtual Stations
Degree Heating Week Charts
HotSpots
SST Anomaly Charts
SST Nighttime Field Image Charts
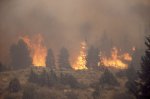
Sample Coral Bleaching HotspotsDetailed Product Information


Fire and Smoke Operational Products
Automated Biomass Burning Algorithm (ABBA) - from CIMSS
Fire Id, Mapping and Monitoring Algorithm (FIMMA)
Fire Product Archive
GOES Aerosol Smoke Products (GASP):
GASP-East AOD and ASDTA Smoke-East AOD
GASP-West AOD and ASDTA Smoke-West AOD
GOES Biomass Burning Emissions Product (GBBEP)  East | West
Hazard Mapping System (HMS) Fire and Smoke Analysis

Developmental Products
Fire Risk
Smoke Text Product
Web Based GIS Fire Analysis

Satellite Imagery
Fire/Smoke/Hot Spot Imagery
Fire/Hot Spot:  Floaters
Fire/Hot Spot Sectors:  Florida  |  Northern California  |  Southern California
GOES-East Sectors:  Regional  |  WFO Sectors
GOES-West Sectors:  Regional  |  WFO Sectors
Operational Significant Event Imagery - Fire Events (Archive)
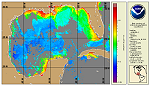
NPS Photo Forest Fire
NPS Photo
Detailed Product Information

Ocean Color Operational Products
Chlorophyll Concentration
MERIS - Daily  |  Bi-Monthly Mean  |  Anomaly
MODIS/Aqua-NIR - Daily  |  Bi-Monthly Mean  |  Anomaly
MODIS/Aqua-SWIR - Daily  |  Bi-Monthly Mean  |  Anomaly
Harmful Algal Bloom Bulletins (National Ocean Service and NESDIS)
http://tidesandcurrents.noaa.gov/hab/
Ocean Color (Remote Sensing Reflectance)
MODIS/Aqua-NIR (667 nm) - Daily  |  Bi-Monthly Mean  |  Anomaly
MODIS/Aqua-SWIR (667 nm) - Daily  |  Bi-Monthly Mean  |  Anomaly
Ocean Color (Water Attenuation Coefficient)
MODIS/Aqua-SWIR (490 nm) - Daily

Developmental Products
Chlorophyll Concentration
MODIS/Terra - Daily  |  Bi-Monthly Mean  |  Anomaly

Ocean Color (Remote Sensing Reflectance)
MERIS (665 nm) - Daily  |  Bi-Monthly Mean  |  Anomaly
MODIS/Terra (667nm) - Daily  |  Bi-Monthly Mean  |  Anomaly

Some of these products have restricted access (More Information).

Sample Ocean Color Image Detailed Product Information


OSEI Imagery Operational Products
Image of the Day

Satellite Imagery
Dust Storms
Fire
Icebergs
Ocean
Severe Weather
Snow Cover
Tropical Cyclones
Volcanoes

Web Site Link
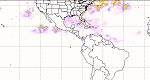
osei imagery Detailed Product Information

Precipitation Operational Products
Ensemble Tropical Rainfall Potential (eTRaP)
Microwave Rain Rate: MSPPS  |  SSM/I  |  SSM/IS
Precipitable Water Index
Rainfall Hydro Estimator
Satellite Precipitation Estimate Messages (SPENES)
Total Precipitable Water ATOVS  |  MSPPS  |  SSM/I

Sample TRaP Image

Detailed Product Information
Tropical Systems Operational Products  (SPSD Tropical Home Page)
Advanced Dvorak Technique - Objective Tropical Storm Classifier
Ensemble Tropical Rainfall Potential (eTRaP)
Multi-Platform Tropical Cyclone Surface Winds Analysis (MTC-SWA)
Tropical Bulletins
Tropical Cyclone Formation Probability Product
Tropical Storm Position and Intensity

Satellite Imagery
Atlantic Ocean and Gulf of Mexico
Geostationary Satellite Server - Hurricane Sectors
Pacific Ocean
Tropical Floaters

Tropical SystemsDetailed Product Information