
Key Facts
- 18.1 million cancer survivors in 2020, 30% more than 2010
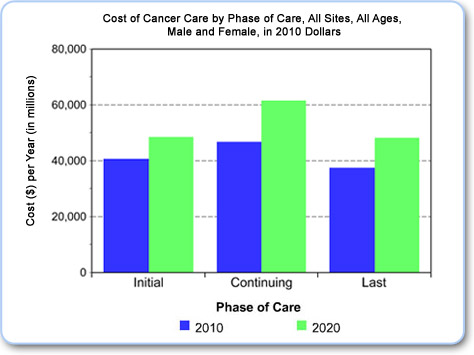
- Costs of cancer care: $157 billion in 2010 dollars
- Growth and aging of the U.S. population is the primary cause
Create Your Own Chart
Graph by Cancer Site and Phase of Cancer(See cost of care or prevalence for cancer site, sex, age and year under various assumptions)
Projection Tables for 2020
National Expenditures for Cancer CareCancer Prevalence
Base Data
Average Annual Costs of CareCancer prevalence was estimated and projected by tumor site through 2020 using incidence and survival data from the Surveillance, Epidemiology, and End Results (SEER) Program and population projections from the U.S. Census Bureau. Annualized net costs of care were estimated using Medicare claims linked to SEER data and adjusted to represent costs in 2010 US dollars.
Different scenarios for assumptions about trends in incidence, survival, and cost were assessed with sensitivity analysis. Projections of current trends in incidence (declining) and survival (increasing) have almost no effect on these estimates. However, if costs of care increase annually by 2% in the initial and last year of life phases of care, the total cost in 2020 is projected to be $174 billion.