Introducing the QCEW State and County Map Application
The Bureau of Labor Statistics (BLS) has developed an interactive state and county map application available at http://beta.bls.gov/maps/cew/us. The application displays geographic economic data through maps, charts, and tables, allowing users to explore employment and wage data of private industry at the National, State, and county level. Throughout this application, URLs are specific to the data displayed, so links can be bookmarked, reused, and shared. The application includes maps, charts, tables, and a link to standard BLS data tables and graphs.
Map features
The maps feature displays data levels and changes at the state or county level.
- To view detail for a specific State or county, click on the desired location.
- To change time periods, industries, color modes, and other map characteristics, select items from the drop-down boxes and then click the Update button.
- To print or save a copy of a map, right click anywhere on the map and make a selection from the resulting menu.
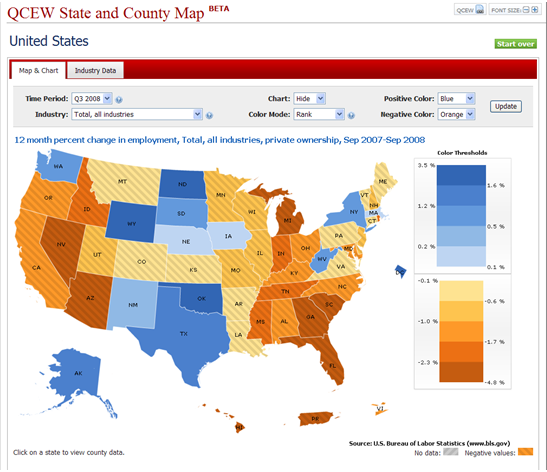
Chart features
The charts feature (shown below) is another new data presentation tool which displays the distribution of the selected variable. To see the chart, select the Chart "Show" option in the map control section.

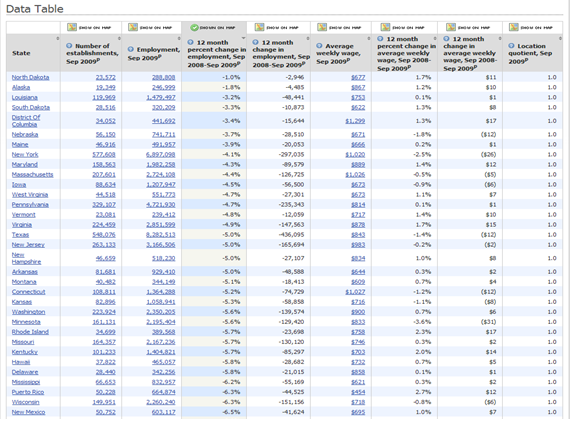
Table features
Multiple table layouts are presented depending on the level of geographic detail.
- The national table displays rows of data by State.
- The state table displays rows of data by county.
- The county table displays industry data for the county.
- National and state industry tables are available by clicking the Industry Data tab, located just above the map.
- Variables can be sorted by clicking on the column header.
- County level data can be accessed by clicking the name of a State.
- An industry supersector table for a particular county can be viewed by clicking on the county's name.
- The variable featured on the map can be changed by clicking the "Show On Map" icon above the column header of the desired variable.
For a single-variable graph and table (shown below), click on any blue underlined value in the Map Application data table.
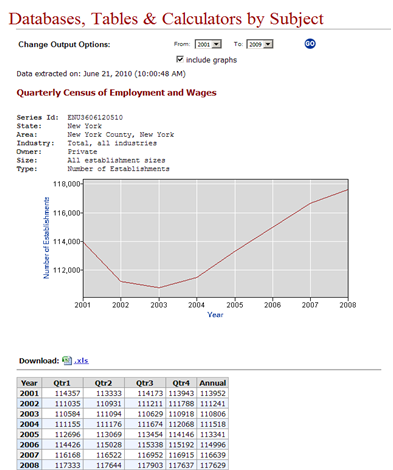
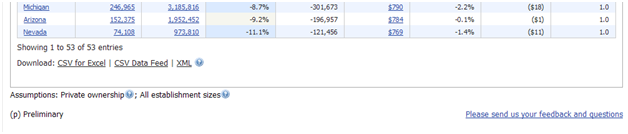
At the bottom of each table are download links. Each table can be downloaded as a CSV file for Microsoft Excel, a CSV data feed for use in "mash-ups", or as an XML file, preformatted for use as a web-based data source.
Contact information
For more information or comments, please contact the QCEW program.