Syndicate content

Blog Category: National Oceanic & Atmospheric Administration

New Smart Phone App Lets Public Report Rain, Hail, Sleet and Snow to NOAA

New Smart Phone App Lets Public Report Rain, Hail, Sleet and Snow to NOAA

Public reports will aid weather research

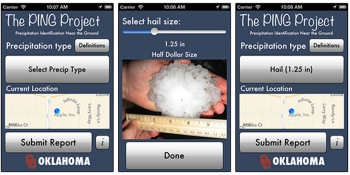
It’s now easier than ever to be a part of the National Oceanic and Atmospheric Administration’s (NOAA) weather research. The NOAA National Severe Storms Laboratory, in partnership with the University of Oklahoma, has launched a free app for users to anonymously report precipitation from their Apple or Android mobile device.

With the mPING app,anyone can send a weather observation on the go. The user simply opens the app, selects the type of precipitation that is falling at his or her location, and presses submit. The user’s location and the time of the observation are automatically included in the report.

All submissions will become part of a research project called PING – Precipitation Identification Near the Ground. NSSL and OU researchers will use the mPING submissions to build a valuable database of tens of thousands of observations from across the United States.  Full press release

NOAA Satellites Aid in 263 Rescues in 2012 After Detecting Distress Signals

Satellites vital to search and rescue operations

The same NOAA weather and climate satellites that accurately tracked Hurricane Sandy’s path in October also played a key role in rescuing 263 people in 111 emergencies in the United States and surrounding waters in 2012.

Since NOAA’s seven operational satellites circle the globe or sit above the United States, they also carry instruments to detect distress signals from emergency beacons carried by downed pilots, shipwrecked boaters and stranded hikers.

In addition to their role in weather prediction, these polar-orbiting and geostationary satellites are part of the international Search and Rescue Satellite-Aided Tracking System, called Cospas-Sarsat. This system uses a network of satellites to quickly pinpoint the location of the distress signals. Release

State-of-the-Art Sonar Map Reveals New Details of Sunken Civil War-era Warship

Top: The USS Hatteras as depicted in a drawing by Civil War artist Francis H. Schell that he titled, “The Destruction of the USA gunboat Hatteras.” Below:  This three-dimensional sonar scan shows remains of the USS Hatteras protruding above the seabed as surveyed in late 2012.

A new, 3-D state-of-the-art sonar map released January 11 by NOAA’s Office of National Marine Sanctuaries, ExploreOcean, Teledyne Blueview, and Northwest Hydro shows never-before-seen details of the USS Hatteras, the only Union warship sunk in combat in the Gulf of Mexico during the Civil War.

One hundred and fifty years ago this month, approximately 20 miles off the coast of Galveston, Texas, the Hatteras, an iron-hulled steamship the U.S. Navy converted into a gunboat, was sunk during a battle with the famous Confederate commerce raider CSS Alabama. The battle was one of the skirmishes that saw the key southern port of Galveston change hands twice and remain one of the last bastions of the Confederacy.

Today, the wreck of the Hatteras is largely intact, resting 57 feet underwater in sand and silt. Recent hurricanes and storms have removed some of the sediment and sand that once encased the vessel like a time capsule. Given shifting sands may once again rebury the Hatteras, the team used a short window of opportunity for a two-day mission last fall to create 3-D photo mosaics of the Hatteras for research, education, and outreach purposes.  Read more  |  Photo gallery

By a Wide Margin, 2012 was the United States’ Warmest Year on Record

Map of U.S. showing temperature anomoly

According to the latest statistics from NOAA’s National Climatic Data Center, the average temperature for the contiguous United States for 2012 was 55.3° Fahrenheit, which was 3.2° Fahrenheit above the twentieth-century average and 1.0° Fahrenheit above the previous record from 1998. The year consisted of the fourth-warmest winter, a record-warm spring, the second-warmest summer, and a warmer-than-average autumn.

The map shows where the 2012 temperatures were different from the 1981–2010 average. Shades of red indicate temperatures up to 8° Fahrenheit warmer than average, and shades of blue indicate temperatures up to 8° Fahrenheit cooler than average—the darker the color, the larger the difference from average temperature. Full release  

Contiguous U.S. Warmer and Drier Than Average for November, Autumn

Map: Contiguous U.S. warmer and drier than average for November, autumn

Drought persists, causing water resource issues for central U.S.; 2012 virtually certain to become warmest year on record for the nation

The average temperature for the contiguous U.S. during November was 44.1°F, 2.1°F above the 20th century average, tying 2004 as the 20th warmest November on record. The autumn contiguous U.S. temperature of 54.7°F was the 21st warmest autumn, 1.1°F above average.

The November nationally-averaged precipitation total of 1.19 inches was 0.93 inch below the long-term average and the 8th driest November on record. The autumn precipitation total for the contiguous U.S. was 5.71 inches, 1.0 inch below average.

  •  November brought warmer-than-average conditions to the western half of the country. The largest temperature departures from average were centered near the Rockies where Arizona, Colorado, New Mexico, Utah, and Wyoming had November temperatures among their ten warmest.
  • The Eastern Seaboard, Ohio Valley, and Southeast were cooler than average during November. North Carolina tied its 10th coolest November on record, with a statewide-averaged temperature 3.5°F below average.
  • A large area of the country experienced below-average precipitation in November. Drier-than-average conditions stretched from the Intermountain West, through the Plains, into the Midwest, and along the entire East Coast. Twenty-two states had monthly precipitation totals ranking among their ten driest.
  • According to the November 27 U.S. Drought Monitor report, 62.7 percent of the contiguous U.S. was experiencing moderate-to-exceptional drought, larger than the 60.2 percent observed at the end of October. Drought conditions improved for parts of the Northern Rockies, which were wetter-than-average during November, while conditions worsened for parts of the Southwest and Mid-Atlantic.

Full release

NOAA: Arctic Continues to Break Records in 2012

Arctic iceberg

Becoming warmer, greener region with record losses of summer sea ice and late spring snow 

The Arctic region continued to break records in 2012—among them the loss of summer sea ice, spring snow cover, and melting of the Greenland ice sheet. This was true even though air temperatures in the Arctic were unremarkable relative to the last decade, according to a new report released today.

“The Arctic is changing in both predictable and unpredictable ways, so we must expect surprises,” said Jane Lubchenco, Ph.D., under secretary of commerce for oceans and atmosphere and NOAA administrator, during a press briefing at the American Geophysical Union annual meeting in San Francisco, Calif. “The Arctic is an extremely sensitive part of the world and with the warming scientists have observed, we see the results with less snow and sea ice, greater ice sheet melt and changing vegetation.”

Lubchenco participated in a panel discussion that presented the annual update of the Arctic Report Card, which has, since 2006, summarized the quickly changing conditions in the Arctic. A record-breaking 141 authors from 15 countries contributed to the peer-reviewed report.  Full NOAA release

NOAA: Busy 2012 Hurricane Season Continues Decades-long High Activity Era in the Atlantic

Satellite view of Hurricane Sandy, 10-29-12

Four U.S. land-falling storms include devastating Sandy and Isaac

November 30 marks the end of the 2012 Atlantic Hurricane season, one that produced 19 named storms, of which 10 became hurricanes and one became a major hurricane. The number of named storms is well above the average of 12. The number of hurricanes is also above the average of six, but the number of major hurricanes is below the average of three. 

Based on the combined number, intensity, and duration of all tropical storms and hurricanes, NOAA classifies the season as above-normal. 2012 was an active year, but not exceptionally so as there were 10 busier years in the last three decades.

This season marks the second consecutive year that the mid-Atlantic and Northeast suffered devastating impacts from a named storm. Sandy, and Irene last year, caused fatalities, injuries, and tremendous destruction from coastal storm surge, heavy rainfall, inland flooding, and wind. Storms struck many parts of the country this year, including tropical storms Beryl and Debby in Florida, Hurricane Isaac in Louisiana, and post-tropical Cyclone Sandy in New Jersey.  Full NOAA release   |  Animation: The 2012 Atlantic Hurricane Season in 4.5 Minutes (You Tube)

Spotlight on Commerce: Timi Vann, NOAA Regional Coordinator

Timi S. Vann

Ed. note: This post is part of the Spotlight on Commerce series highlighting members of the Department of Commerce and their contributions to an Economy Built to Last.

Guest blog by Timi Vann, Western Regional Collaboration Coordinator, National Oceanic and Atmospheric Administration

I serve as one of the National Oceanic and Atmospheric Administration's (NOAA) eight regional coordinators. In this capacity, I am responsible for coordinating the collaborative activities of a 17-member team of scientists, engineers and program managers representing NOAA’s four service branches (Weather, Fisheries, Environmental Satellite, Data and information, and Ocean Services) and Office of Oceanic and Atmospheric Research in the eleven state region of the Western United States. This team works together to exchange information, leverage resources, and collaborate to address priority regional issues and deliver improved science and services to regional stakeholders.

I was born and raised in Seattle, Wash., and I am Cherokee Indian, as is my husband. After undergraduate studies at The Evergreen State College and graduate studies at the University of Oklahoma, I completed further coursework in satellite remote sensing, image processing, and physics from the University of New Orleans.  After college, I worked with the US Army at Fort Lewis as a cultural resources specialist working to support the military training mission through effective and efficient environmental compliance as it pertained to historic buildings and landscapes, historic and prehistoric archeological sites, traditional cultural properties, and tribal government relations. I then went on to a successful career at NASA working to develop "real world" applications of NASA's satellite data for environmental health tracking and disease surveillance. These experiences enabled me to successfully take on many new challenges at NOAA.

Acting Secretary Blank Visits New Jersey to Meet Business Owners Impacted by Sandy

Acting Secretary Blank and Acting Assistant Secretary Erskine survey a map of the Port of Newark

On Wednesday, Acting Secretary of Commerce Rebecca Blank traveled to New Jersey where she met with local business leaders for discussions about ongoing efforts to rebuild the region in the aftermath of Hurricane Sandy. During these conversations, she conveyed that the Commerce Department, the Federal Emergency Management Agency, and the administration are focused on providing businesses and communities affected by Hurricane Sandy with all available federal support. 

In Elizabeth, New Jersey, Acting Secretary Blank met with a group of businesses that were impacted by the storm. Dr. Blank then visited the Port of Newark in Port Newark, New Jersey, where she was briefed by officials on the status of port operations and the challenges moving forward. She heard from some of the port’s tenants, trucking companies, and freight mobility experts about the impact that the storm has had on their businesses, customers, and employees. Dr. Blank then took a tour of the port to observe the progress of recovery work that is currently underway. 

NOAA: U.S. Temperature and Precipitation in October Were Near Average

Map of U.S. showing significant areas of weather activity in October 2012

Sandy breaks records in East as severe drought continues in West, Great Plains

According to NOAA’s National Climatic Data Center scientists, the average temperature for the contiguous U.S. during October was 53.9°F, 0.3°F below the long-term average. This ends a 16-month streak of above-average temperatures for the Lower 48 that began in June 2011.

The October nationally averaged precipitation total of 2.19 inches was slightly above the long-term average. The Northwest, Midwest, and Northeast were wetter than average, while below-average precipitation was observed across the Southern Rockies and the Central and Southern Plains. As of October 30, 60.2 percent of the contiguous U.S. was experiencing drought conditions with the most severe conditions in the Great Plains. Full report